OPEN-SOURCE SCRIPT
AI Volume Signals
AI Volume Signals
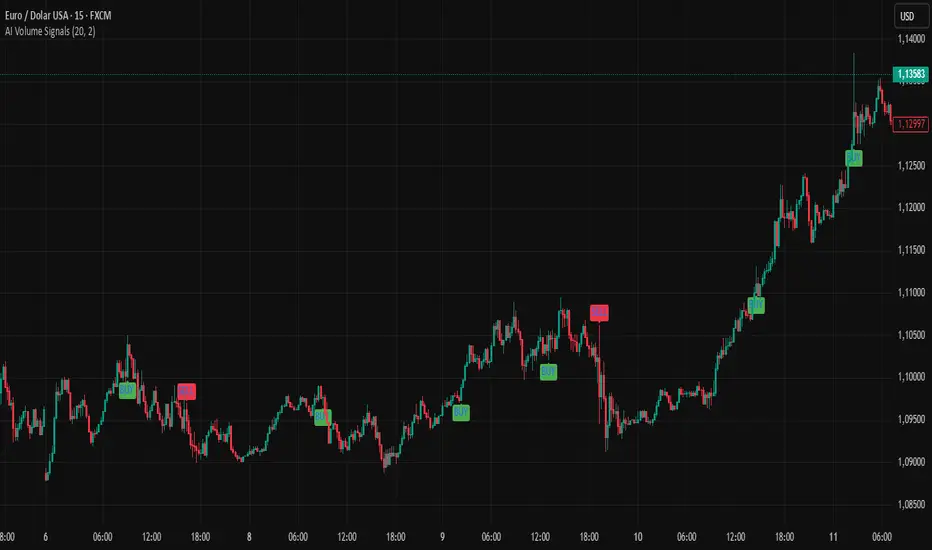
The AI Volume Signals indicator detects significant volume spikes and combines them with trend direction and candle color to generate buy and sell signals. This script utilizes an Exponential Moving Average (EMA) of volume to detect abnormal volume spikes, which could indicate strong market activity. It also filters signals based on the trend direction determined by a 50-period EMA of the price.
Key Features:
Volume Spike Detection: The indicator detects when the current volume exceeds the EMA of volume by a user-defined multiplier, signaling an unusual increase in market activity.
Trend Direction Filter: The 50-period EMA of the price is used to determine the market trend. Buy signals are generated when the price is above the EMA (uptrend), and sell signals occur when the price is below the EMA (downtrend).
Candle Color Filter: The indicator only generates a buy signal when the current candle is bullish (green), and a sell signal when the current candle is bearish (red).
Optional Volume EMA Line: A customizable option allows users to toggle the visibility of the Volume EMA line on the chart. By default, the line is hidden, but can be enabled in the settings.
Signals:
Buy Signal: Generated when a volume spike occurs, the trend is upward, and the current candle is bullish.
Sell Signal: Generated when a volume spike occurs, the trend is downward, and the current candle is bearish.
Alerts:
Buy Alert: Alerts the user when a buy signal is triggered.
Sell Alert: Alerts the user when a sell signal is triggered.
Visualization:
Buy Signal: A green label appears below the bar when the buy conditions are met.
Sell Signal: A red label appears above the bar when the sell conditions are met.
Volume EMA: A line representing the EMA of the volume is plotted on the chart for reference. The visibility of this line can be toggled in the settings.
This indicator can help traders identify potential entry points based on increased volume activity while considering trend direction and candlestick patterns.
開源腳本
秉持TradingView一貫精神,這個腳本的創作者將其設為開源,以便交易者檢視並驗證其功能。向作者致敬!您可以免費使用此腳本,但請注意,重新發佈代碼需遵守我們的社群規範。
免責聲明
這些資訊和出版物並非旨在提供,也不構成TradingView提供或認可的任何形式的財務、投資、交易或其他類型的建議或推薦。請閱讀使用條款以了解更多資訊。
開源腳本
秉持TradingView一貫精神,這個腳本的創作者將其設為開源,以便交易者檢視並驗證其功能。向作者致敬!您可以免費使用此腳本,但請注意,重新發佈代碼需遵守我們的社群規範。
免責聲明
這些資訊和出版物並非旨在提供,也不構成TradingView提供或認可的任何形式的財務、投資、交易或其他類型的建議或推薦。請閱讀使用條款以了解更多資訊。