OPEN-SOURCE SCRIPT
RSI Scanner
RSI Scanner
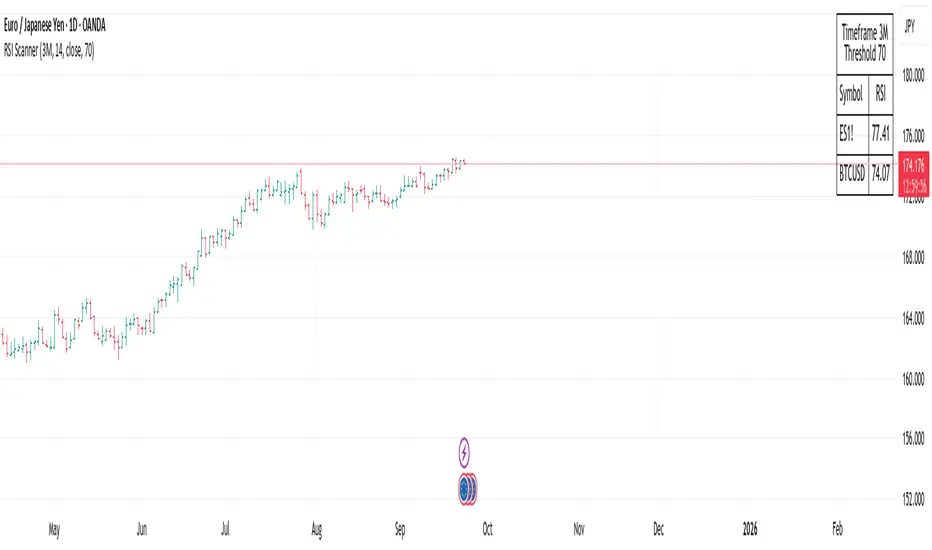
This script scans a custom list of symbols and displays their RSI values for a selected higher timeframe (default: 3M). It provides a quick way to monitor multiple markets in one place without switching charts.
Features:
How to use:
Use cases:
This script scans a custom list of symbols and displays their RSI values for a selected higher timeframe (default: 3M). It provides a quick way to monitor multiple markets in one place without switching charts.
Features:
- Customizable timeframe for RSI calculation (default: 3M).
- Adjustable RSI length and source input.
- Flexible filter: display all symbols or only those with RSI above a chosen threshold.
- Input your own list of symbols (stocks, forex, futures, crypto) via a text field.
- Results displayed in a clean, table directly on the chart.
- Automatic column split when the symbol list is long.
- Table header shows selected timeframe and filter settings for clarity.
How to use:
- Add the script to your chart.
- Open the Inputs panel.
- In Symbols List, enter the tickers you want to track, separated by commas (e.g. AAPL, TSLA, EURUSD, BTCUSD).
- Set the desired Timeframe (e.g. 3M, 1M, W).
- Adjust RSI Length and Source if needed.
- Enable or disable filtering:
If filtering is enabled, only symbols with RSI ≥ the threshold will be shown.
If disabled, all entered symbols will be displayed. - The table in the top-right corner will update automatically on the last bar.
Use cases:
- Monitor RSI across different asset classes on higher timeframes.
- Quickly spot overbought symbols (e.g. RSI > 70) without switching charts.
- Create a custom multi-market watchlist tailored to your strategy.
開源腳本
秉持TradingView一貫精神,這個腳本的創作者將其設為開源,以便交易者檢視並驗證其功能。向作者致敬!您可以免費使用此腳本,但請注意,重新發佈代碼需遵守我們的社群規範。
免責聲明
這些資訊和出版物並非旨在提供,也不構成TradingView提供或認可的任何形式的財務、投資、交易或其他類型的建議或推薦。請閱讀使用條款以了解更多資訊。
開源腳本
秉持TradingView一貫精神,這個腳本的創作者將其設為開源,以便交易者檢視並驗證其功能。向作者致敬!您可以免費使用此腳本,但請注意,重新發佈代碼需遵守我們的社群規範。
免責聲明
這些資訊和出版物並非旨在提供,也不構成TradingView提供或認可的任何形式的財務、投資、交易或其他類型的建議或推薦。請閱讀使用條款以了解更多資訊。