OPEN-SOURCE SCRIPT
Correlation Zones
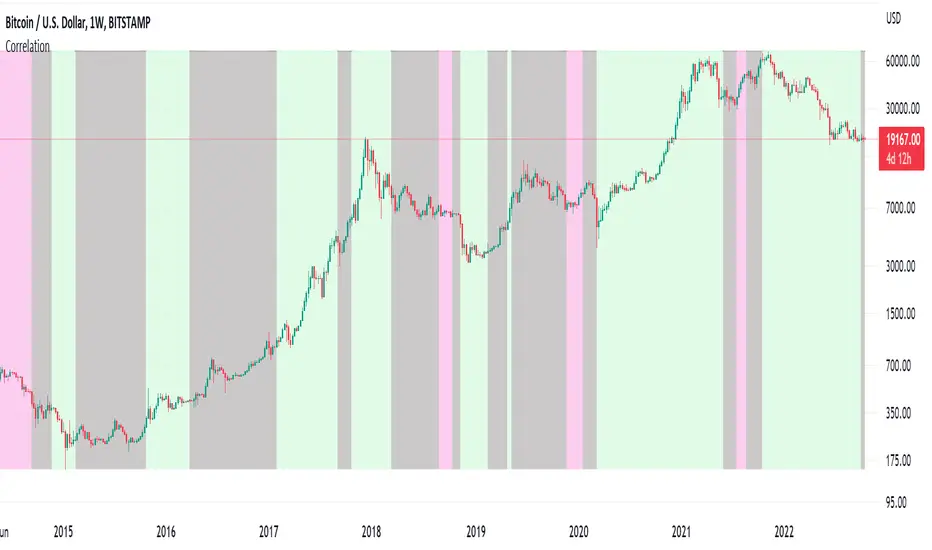
This indicator highlights zones with strong, weak and negative correlation. Unlike standard coefficient indicator it will help to filter out noise when analyzing dependencies between two assets.
With default input setting Correlation_Threshold=0.5:
- Zones with correlation above 0.5, will be colored in green (strong correlation)
- Zones with correlation from -0.5 to 0.5 will be colored grey (weak correlation)
- Zones with correlation below -0.5 will be colore red (strong negative correlation)
Input parameter "Correlation_Threshold" can be modified in settings.
Provided example demonstrates BTCUSD correlation with NASDAQ Composite . I advice to use weekly timeframe and set length to 26 week for this study
開源腳本
秉持TradingView一貫精神,這個腳本的創作者將其設為開源,以便交易者檢視並驗證其功能。向作者致敬!您可以免費使用此腳本,但請注意,重新發佈代碼需遵守我們的社群規範。
免責聲明
這些資訊和出版物並非旨在提供,也不構成TradingView提供或認可的任何形式的財務、投資、交易或其他類型的建議或推薦。請閱讀使用條款以了解更多資訊。
免責聲明
這些資訊和出版物並非旨在提供,也不構成TradingView提供或認可的任何形式的財務、投資、交易或其他類型的建議或推薦。請閱讀使用條款以了解更多資訊。