OPEN-SOURCE SCRIPT
已更新 Bitfinex BTC longs/total ratio
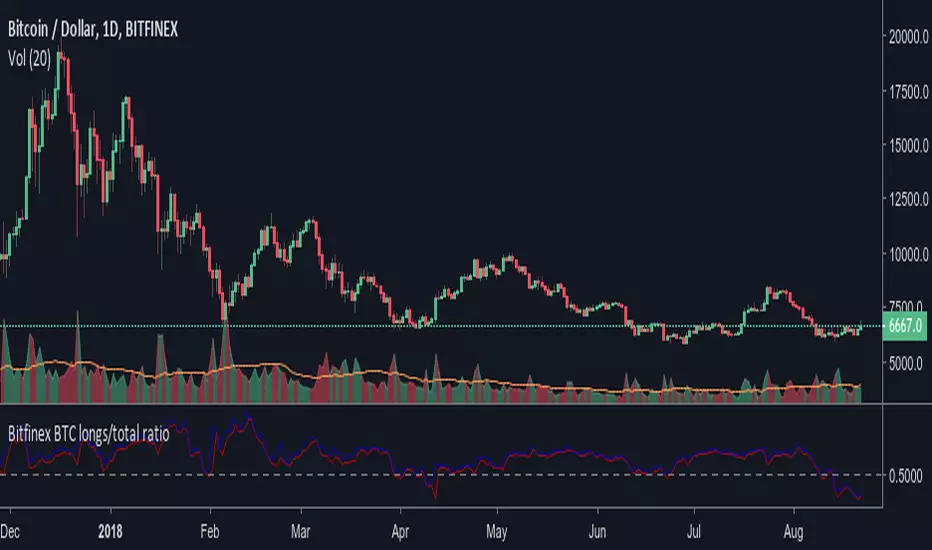
Ratio of bitfinex longs versus the total btc in positions. Maybe a good indicator of market sentiment. It allows you to see too where were people taking profit or closing positions. Remember that ratio going up doesn't necesarily mean more longs positions are being added. It could mean shorts are closing position massively. The conversely is also true.
The rate above 0.5 doesn't necesarily bullish, though, and the indicator is "timeframe" agnostic. So take into account that there could be tons of longs positions that were opened since back before summer 2017, It seems to be too of positions opened at prices below 4.000$. That's why the average seems to be around 0.6.
The blue lines indicates current ratio (or on close for past bars). The red line is the max ratio (higher shorts versus lowest longs).
發行說明
Now, it adds the BTCEUR and BTCJPY pairs to the calculation, in case the metric changes in some point in the future, but so far it is irrelevant since the 98% of positions are in the BTCUSD market.發行說明
- Removed EUR/JPY positions. Amounts too tiny in comparision with BTCUSD and the load time of the scripts increases significantly.- Now you can see the change ratio of longs (green), shorts (red) and shorts+longs (gray) per candle. For example, a value of -0.1 for shorts means the shorts has drop a 10% respect to the previous bar/candle.
- The longs/total ratio (blue) now applies a -0.5, to center the line with respect to the other lines, so they are more comfortable to see. A value of 0.1 means the longs/total ratio is 0.5+0.1, or 60% of total.
開源腳本
本著TradingView的真正精神,此腳本的創建者將其開源,以便交易者可以查看和驗證其功能。向作者致敬!雖然您可以免費使用它,但請記住,重新發佈程式碼必須遵守我們的網站規則。
免責聲明
這些資訊和出版物並不意味著也不構成TradingView提供或認可的金融、投資、交易或其他類型的意見或建議。請在使用條款閱讀更多資訊。
開源腳本
本著TradingView的真正精神,此腳本的創建者將其開源,以便交易者可以查看和驗證其功能。向作者致敬!雖然您可以免費使用它,但請記住,重新發佈程式碼必須遵守我們的網站規則。
免責聲明
這些資訊和出版物並不意味著也不構成TradingView提供或認可的金融、投資、交易或其他類型的意見或建議。請在使用條款閱讀更多資訊。