OPEN-SOURCE SCRIPT
WLD Estrategia Compra/Venta Multi Indicadores
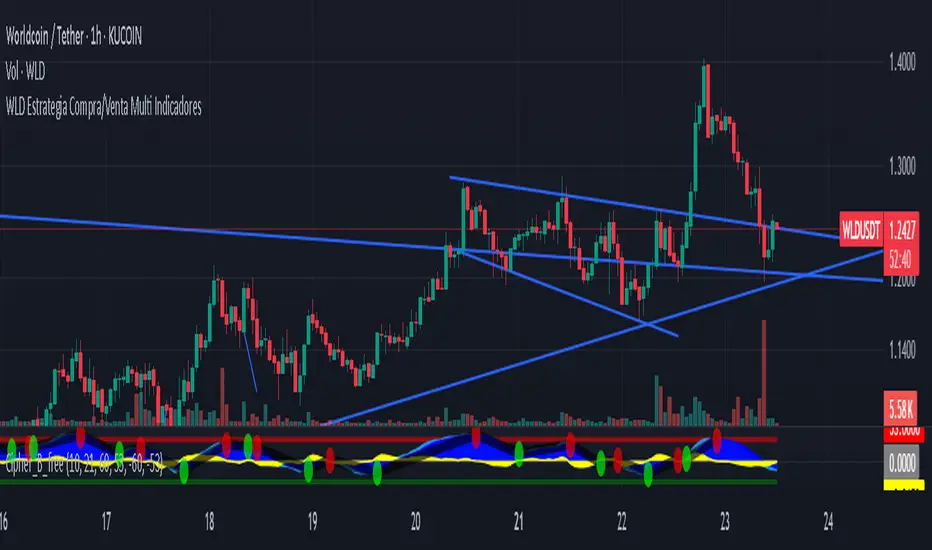
A BUY signal is only triggered when all the following are true:
RSI < 30
Indicates oversold territory—potential for a bounce.
MACD crossover upward
The MACD line crosses above the signal line, a bullish momentum shift.
MA50 > MA200
Confirms an overall bullish trend (Golden Cross).
Price below lower Bollinger Band
Shows price is at an extreme low (potential reversal zone).
Stochastic RSI < 20
Adds confirmation of short-term oversold condition.
When all are true simultaneously, a BUY signal is triggered.
A SELL signal is triggered when all the following are true:
RSI > 70
Indicates the asset is overbought—risk of pullback.
MACD crossover downward
The MACD line crosses below the signal line—bearish shift.
MA50 < MA200
Confirms a bearish trend (Death Cross).
Price above upper Bollinger Band
Suggests price is at an extreme high—potential exhaustion.
Stochastic RSI > 80
Confirms short-term overbought momentum.
When all conditions align, a SELL signal is triggered.
開源腳本
本著TradingView的真正精神,此腳本的創建者將其開源,以便交易者可以查看和驗證其功能。向作者致敬!雖然您可以免費使用它,但請記住,重新發佈程式碼必須遵守我們的網站規則。
免責聲明
這些資訊和出版物並不意味著也不構成TradingView提供或認可的金融、投資、交易或其他類型的意見或建議。請在使用條款閱讀更多資訊。
開源腳本
本著TradingView的真正精神,此腳本的創建者將其開源,以便交易者可以查看和驗證其功能。向作者致敬!雖然您可以免費使用它,但請記住,重新發佈程式碼必須遵守我們的網站規則。
免責聲明
這些資訊和出版物並不意味著也不構成TradingView提供或認可的金融、投資、交易或其他類型的意見或建議。請在使用條款閱讀更多資訊。