OPEN-SOURCE SCRIPT
Cypto Oscillator with Sortino-like Volatility
Enhanced Inverted Ultimate Oscillator with Sortino-like Volatility
This indicator combines the power of the Ultimate Oscillator with a unique Sortino-like volatility calculation to provide a comprehensive view of market dynamics. It's designed to help traders identify potential turning points and assess the risk associated with price movements.
**Core Components:**
* **Ultimate Oscillator (UO):** The UO is a momentum indicator that incorporates short, medium, and long-term price action to identify overbought and oversold conditions. This indicator inverts and normalizes the UO to a 0-10 scale, providing a clear view of momentum shifts.
* **Sortino-like Volatility:** Instead of a standard deviation, this indicator uses a downside deviation calculation. This focuses specifically on *negative* price movements, offering a more relevant measure of risk for most traders. By not penalizing upside volatility, it avoids giving false signals during strong bull runs. The downside deviation is scaled as a percentage of the closing price for cross-asset comparability.
* **Volatility Signal:** The inverted UO is multiplied by the downside deviation to create a combined volatility signal. This signal reflects both momentum and downside risk, providing a more nuanced market perspective.
**Key Features and Uses:**
* **Identifying Potential Turning Points:** Divergences between the UO and price action can signal potential trend reversals. Look for the UO to make higher lows while price makes lower lows (bullish divergence) or the UO to make lower highs while price makes higher highs (bearish divergence).
* **Assessing Downside Risk:** The Sortino-like volatility component helps traders gauge the potential for downside price swings. Higher volatility suggests greater risk.
* **Dynamic Volatility Thresholds:** The indicator includes adjustable upper and lower volatility thresholds, based on a moving average of the volatility signal. These thresholds can be used to identify periods of unusually high or low volatility.
* **Customizable Lookback Periods:** Traders can adjust the lookback periods for the UO and the standard deviation calculation to fine-tune the indicator to their specific trading style and market conditions.
* **Visualizations:** The indicator provides several visual aids, including:
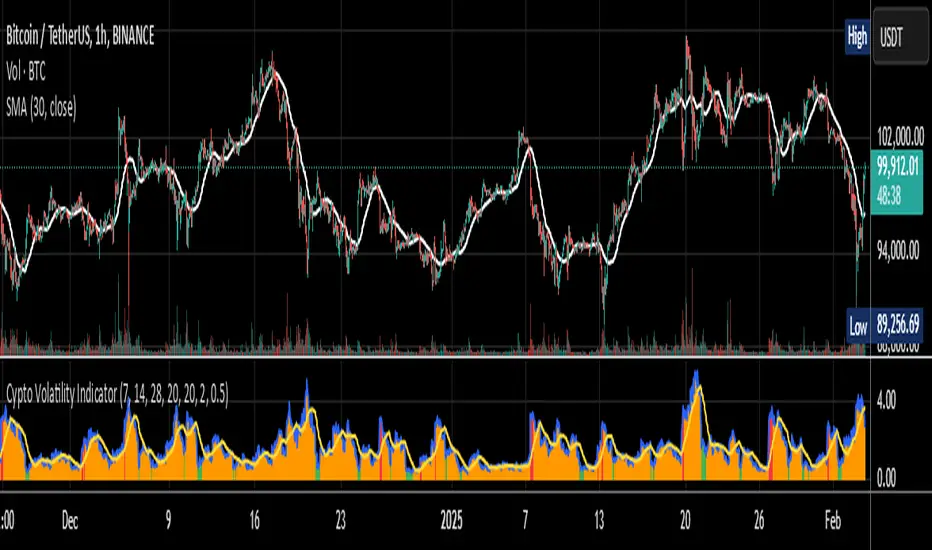
* A histogram of the volatility signal, colored dynamically based on its relationship to the moving average of volatility. Red indicates volatility above the upper bound, orange between the bounds and green below the lower bound.
* A line plot of the volatility signal.
* An optional moving average of the volatility signal.
* Optional upper and lower volatility threshold lines with a filled range for visual clarity.
* **Alerts:** The indicator includes alert conditions for when the volatility signal crosses above the upper threshold (high volatility) or below the lower threshold (low volatility).
**How to Use:**
1. **Inputs:** Adjust the input parameters to optimize the indicator for your chosen asset and timeframe.
2. **Divergences:** Look for divergences between the UO and price to identify potential trend reversals.
3. **Volatility:** Use the volatility signal and thresholds to assess downside risk.
4. **Alerts:** Enable alerts to be notified of high or low volatility events.
**Disclaimer:** This indicator is for informational purposes only and should not be considered financial advice. Always conduct your own thorough analysis before making any trading decisions.
Key improvements in this description:
Clear and concise language: Easy for traders to understand.
Focus on benefits: Highlights how the indicator can help traders.
Detailed explanation of features: Covers all the important aspects.
How-to-use section: Provides practical guidance.
Disclaimer: Includes a necessary disclaimer.
Emphasis on the Sortino-like approach: This is a unique selling point of your indicator.
Well-structured and formatted: Easy to read and digest.
This description should be a great starting point for sharing your indicator with the TradingView community. You can further customize it by adding screenshots of the indicator in action or linking to a chart where it's being used. Remember to respond to comments and questions from other users to build engagement and improve your indicator over time.
This indicator combines the power of the Ultimate Oscillator with a unique Sortino-like volatility calculation to provide a comprehensive view of market dynamics. It's designed to help traders identify potential turning points and assess the risk associated with price movements.
**Core Components:**
* **Ultimate Oscillator (UO):** The UO is a momentum indicator that incorporates short, medium, and long-term price action to identify overbought and oversold conditions. This indicator inverts and normalizes the UO to a 0-10 scale, providing a clear view of momentum shifts.
* **Sortino-like Volatility:** Instead of a standard deviation, this indicator uses a downside deviation calculation. This focuses specifically on *negative* price movements, offering a more relevant measure of risk for most traders. By not penalizing upside volatility, it avoids giving false signals during strong bull runs. The downside deviation is scaled as a percentage of the closing price for cross-asset comparability.
* **Volatility Signal:** The inverted UO is multiplied by the downside deviation to create a combined volatility signal. This signal reflects both momentum and downside risk, providing a more nuanced market perspective.
**Key Features and Uses:**
* **Identifying Potential Turning Points:** Divergences between the UO and price action can signal potential trend reversals. Look for the UO to make higher lows while price makes lower lows (bullish divergence) or the UO to make lower highs while price makes higher highs (bearish divergence).
* **Assessing Downside Risk:** The Sortino-like volatility component helps traders gauge the potential for downside price swings. Higher volatility suggests greater risk.
* **Dynamic Volatility Thresholds:** The indicator includes adjustable upper and lower volatility thresholds, based on a moving average of the volatility signal. These thresholds can be used to identify periods of unusually high or low volatility.
* **Customizable Lookback Periods:** Traders can adjust the lookback periods for the UO and the standard deviation calculation to fine-tune the indicator to their specific trading style and market conditions.
* **Visualizations:** The indicator provides several visual aids, including:
* A histogram of the volatility signal, colored dynamically based on its relationship to the moving average of volatility. Red indicates volatility above the upper bound, orange between the bounds and green below the lower bound.
* A line plot of the volatility signal.
* An optional moving average of the volatility signal.
* Optional upper and lower volatility threshold lines with a filled range for visual clarity.
* **Alerts:** The indicator includes alert conditions for when the volatility signal crosses above the upper threshold (high volatility) or below the lower threshold (low volatility).
**How to Use:**
1. **Inputs:** Adjust the input parameters to optimize the indicator for your chosen asset and timeframe.
2. **Divergences:** Look for divergences between the UO and price to identify potential trend reversals.
3. **Volatility:** Use the volatility signal and thresholds to assess downside risk.
4. **Alerts:** Enable alerts to be notified of high or low volatility events.
**Disclaimer:** This indicator is for informational purposes only and should not be considered financial advice. Always conduct your own thorough analysis before making any trading decisions.
Key improvements in this description:
Clear and concise language: Easy for traders to understand.
Focus on benefits: Highlights how the indicator can help traders.
Detailed explanation of features: Covers all the important aspects.
How-to-use section: Provides practical guidance.
Disclaimer: Includes a necessary disclaimer.
Emphasis on the Sortino-like approach: This is a unique selling point of your indicator.
Well-structured and formatted: Easy to read and digest.
This description should be a great starting point for sharing your indicator with the TradingView community. You can further customize it by adding screenshots of the indicator in action or linking to a chart where it's being used. Remember to respond to comments and questions from other users to build engagement and improve your indicator over time.
開源腳本
秉持TradingView一貫精神,這個腳本的創作者將其設為開源,以便交易者檢視並驗證其功能。向作者致敬!您可以免費使用此腳本,但請注意,重新發佈代碼需遵守我們的社群規範。
免責聲明
這些資訊和出版物並非旨在提供,也不構成TradingView提供或認可的任何形式的財務、投資、交易或其他類型的建議或推薦。請閱讀使用條款以了解更多資訊。
開源腳本
秉持TradingView一貫精神,這個腳本的創作者將其設為開源,以便交易者檢視並驗證其功能。向作者致敬!您可以免費使用此腳本,但請注意,重新發佈代碼需遵守我們的社群規範。
免責聲明
這些資訊和出版物並非旨在提供,也不構成TradingView提供或認可的任何形式的財務、投資、交易或其他類型的建議或推薦。請閱讀使用條款以了解更多資訊。