OPEN-SOURCE SCRIPT
Inverse Moving Average Weighted (IWMA)
Description:
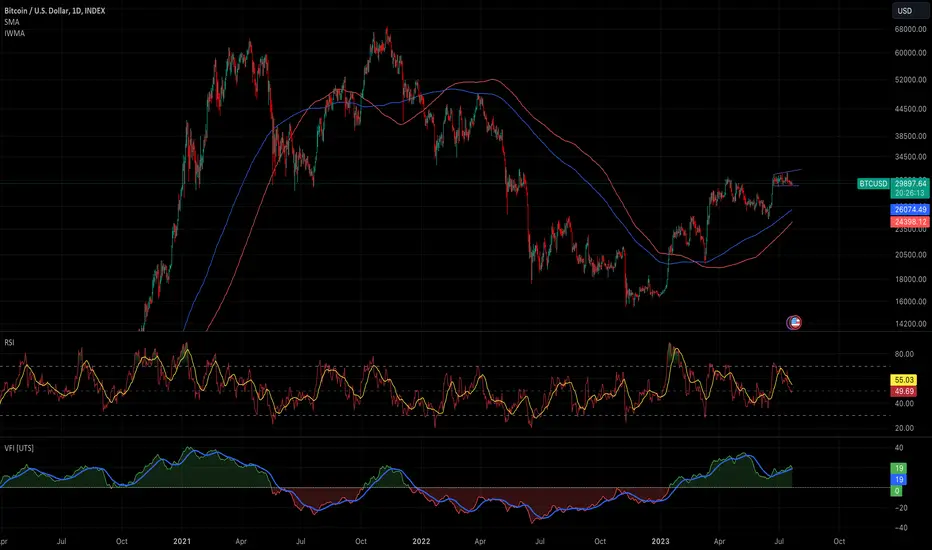
The Inverse Weighted Moving Average (IWMA) is a unique technical indicator that puts more emphasis on older price data compared to recent data. Unlike traditional moving averages that give more weight to recent data, the IWMA believes that older data points have a larger psychological impact on traders and therefore should be given more importance.
The IWMA is calculated by assigning weights to the price data points in a moving window, with the oldest data point given the highest weight and the most recent data point given the lowest weight. These weights are then used to calculate a weighted average, which forms the IWMA.
The IWMA can be used in the same way as other moving averages. When the price crosses above the IWMA, it may indicate a potential upward trend, signaling a good time to buy. Conversely, when the price crosses below the IWMA, it may indicate a potential downward trend, signaling a good time to sell.
The IWMA is a unique tool for traders who believe in the lasting impact of older price data. It provides a different perspective on price trends and can be a valuable addition to your trading toolkit.
開源腳本
秉持TradingView一貫精神,這個腳本的創作者將其設為開源,以便交易者檢視並驗證其功能。向作者致敬!您可以免費使用此腳本,但請注意,重新發佈代碼需遵守我們的社群規範。
免責聲明
這些資訊和出版物並非旨在提供,也不構成TradingView提供或認可的任何形式的財務、投資、交易或其他類型的建議或推薦。請閱讀使用條款以了解更多資訊。
開源腳本
秉持TradingView一貫精神,這個腳本的創作者將其設為開源,以便交易者檢視並驗證其功能。向作者致敬!您可以免費使用此腳本,但請注意,重新發佈代碼需遵守我們的社群規範。
免責聲明
這些資訊和出版物並非旨在提供,也不構成TradingView提供或認可的任何形式的財務、投資、交易或其他類型的建議或推薦。請閱讀使用條款以了解更多資訊。