OPEN-SOURCE SCRIPT
Williams Percent Range with Threshold
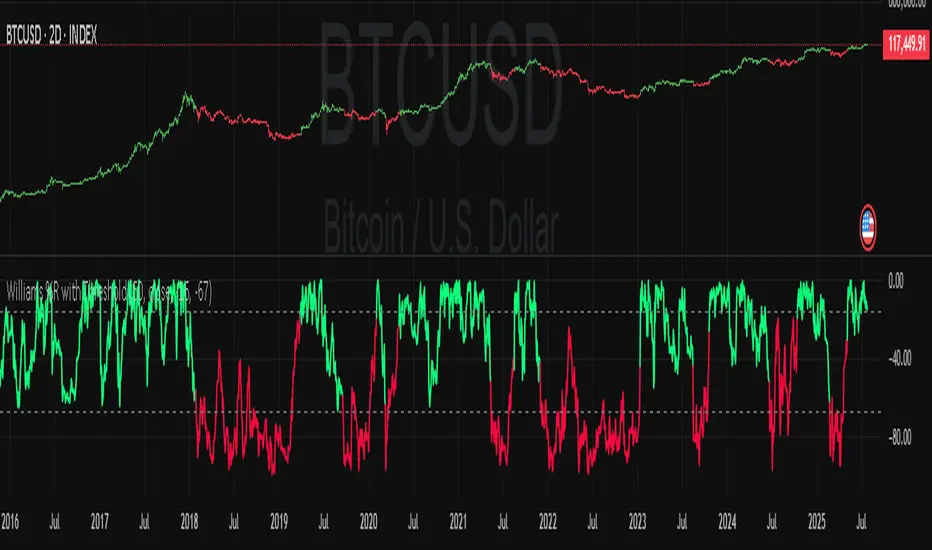
Enhance your trading analysis with the "Williams Percent Range with Threshold" indicator, a powerful modification of the classic Williams %R oscillator. This custom version introduces customizable uptrend and downtrend thresholds, combined with dynamic candlestick coloring to visually highlight market trends. Originally designed to identify overbought and oversold conditions, this script takes it a step further by allowing traders to define specific threshold levels for trend detection, making it a versatile tool for momentum and trend-following strategies.
Key Features:
Customizable Thresholds: Set your own uptrend (default: -16) and downtrend (default: -67) thresholds to adapt the indicator to your trading style.
Dynamic Candlestick Coloring: Candles turn green during uptrends, red during downtrends, and gray in neutral conditions, providing an intuitive visual cue directly on the price chart.
Flexible Length: Adjust the lookback period (default: 50) to fine-tune sensitivity.
Overlay Design: Integrates seamlessly with your price chart, enhancing readability without clutter.
How It Works:
The Williams %R calculates the current closing price's position relative to the highest and lowest prices over a specified period, expressed as a percentage between -100 and 0. This version adds trend detection based on user-defined thresholds, with candlestick colors reflecting the trend state. The indicator plots the %R line with color changes (green for uptrend, red for downtrend) and includes dashed lines for the custom thresholds.
Usage Tips:
Use the uptrend threshold (-16 by default) to identify potential buying opportunities when %R exceeds this level.
Apply the downtrend threshold (-67 by default) to spot selling opportunities when %R falls below.
Combine with other indicators (e.g., moving averages or support/resistance levels) for confirmation signals.
Adjust the length and thresholds based on the asset's volatility and your trading timeframe.
開源腳本
秉持TradingView一貫精神,這個腳本的創作者將其設為開源,以便交易者檢視並驗證其功能。向作者致敬!您可以免費使用此腳本,但請注意,重新發佈代碼需遵守我們的社群規範。
免責聲明
這些資訊和出版物並非旨在提供,也不構成TradingView提供或認可的任何形式的財務、投資、交易或其他類型的建議或推薦。請閱讀使用條款以了解更多資訊。
免責聲明
這些資訊和出版物並非旨在提供,也不構成TradingView提供或認可的任何形式的財務、投資、交易或其他類型的建議或推薦。請閱讀使用條款以了解更多資訊。