OPEN-SOURCE SCRIPT
已更新 BB Support & Resistance
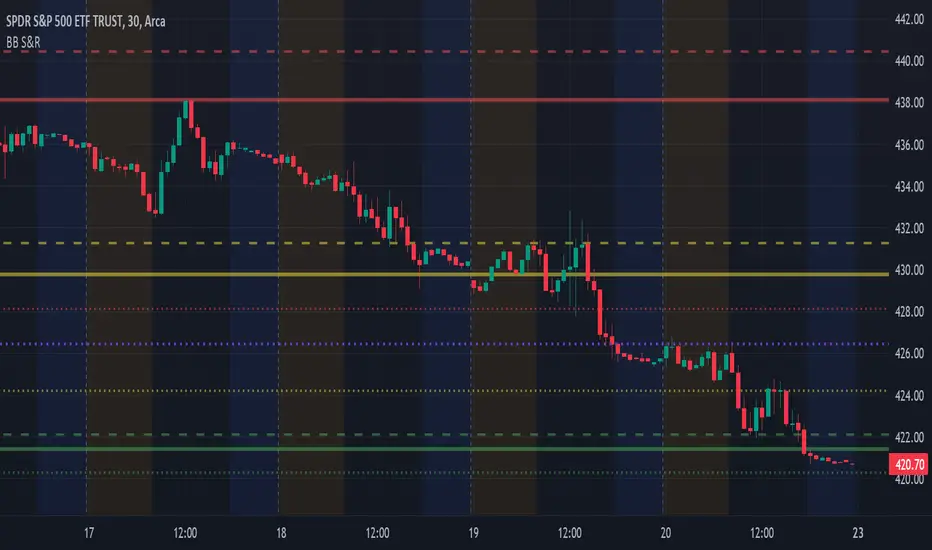
Choosing support and resistance can be time consuming and subjective. Personally, I don't want to spend too much time manually marking up charts. Credit to video I saw, forget the producer, that demonstrated how multi-time frame Bollinger Bands can act as support and resistance. I suggest reading up on Bollinger Bands (en.wikipedia.org/wiki/Bollinger_Bands) and how to trade them. This indicator draws support and resistance lines based on Bollinger Bands on three time frames. You can select 1 or all three time frames to display on your chart. Enjoy.
發行說明
Choosing support and resistance can be time consuming and subjective. Personally, I don't want to spend too much time manually marking up charts. Credit to video I saw, forget the producer, that demonstrated how multi-time frame Bollinger Bands can act as support and resistance. I suggest reading up on Bollinger Bands (en.wikipedia.org/wiki/Bollinger Bands) and how to use them in your trading. This indicator draws support and resistance lines based on Bollinger Bands on three time frames. You can select 1 or all three time frames to display on your chart. Enjoy.Updated...Added option to set S&R line colors by time frame.
開源腳本
秉持TradingView一貫精神,這個腳本的創作者將其設為開源,以便交易者檢視並驗證其功能。向作者致敬!您可以免費使用此腳本,但請注意,重新發佈代碼需遵守我們的社群規範。
免責聲明
這些資訊和出版物並非旨在提供,也不構成TradingView提供或認可的任何形式的財務、投資、交易或其他類型的建議或推薦。請閱讀使用條款以了解更多資訊。
免責聲明
這些資訊和出版物並非旨在提供,也不構成TradingView提供或認可的任何形式的財務、投資、交易或其他類型的建議或推薦。請閱讀使用條款以了解更多資訊。