OPEN-SOURCE SCRIPT
Session Volume Spike Detector (MTF Arrows)
Overview
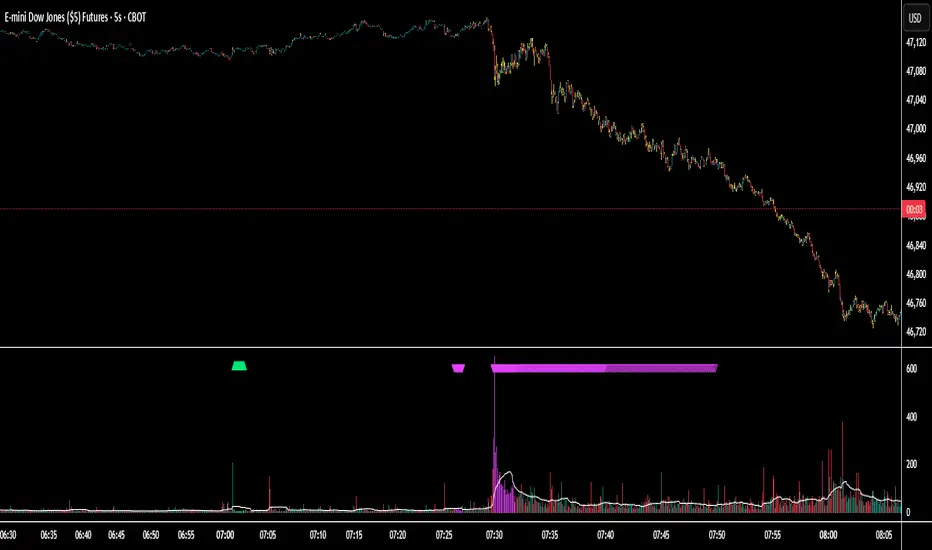
The Session Volume Spike Detector is a precision multi-timeframe (MTF) tool that identifies sudden surges in buy or sell volume during key market windows. It highlights high-impact institutional participation by comparing current volume against its historical baseline and short-term highs, then plots directional markers on your chart.
This version adds MTF awareness, showing spikes from 1-minute, 5-minute, and 10-minute frames on a single chart. It’s ideal for traders monitoring microstructure shifts across multiple time compressions while staying on a fast chart (like 1-second or 1-minute).
Key Features
Dual Session Windows (DST-aware)
Automatically tracks Morning (05:30–08:30 MT) and Midday (11:00–13:30 MT) activity, adjusted for daylight savings.
Directional Spike Detection
Flags Buy spikes (green triangles) and Sell spikes (magenta triangles) using dynamic volume gates, Z-Score normalization, and recent-bar jump filters.
Multi-Timeframe Projection
Displays higher-timeframe (1m / 5m / 10m) spikes directly on your active chart for continuous visual context — even on sub-minute intervals.
Adaptive Volume Logic
Each spike is validated against:
Volume ≥ SMA × multiplier
Volume ≥ recent-high × jump factor
Optional Z-Score threshold for statistical significance
Session-Only Filtering
Ensures spikes are only plotted within specified trading sessions — ideal for futures or intraday equity traders.
Configurable Alerts
Built-in alert conditions for:
Any timeframe (MTF aggregate)
Individual 1m, 5m, or 10m windows
Alerts trigger only when a new qualifying spike appears at the close of its bar.
Use Cases
Detect algorithmic or institutional activity bursts inside your trading window.
Track confluence of volume surges across multiple timeframes.
Combine with FVGs, bank levels, or range breakouts to identify probable continuation or reversal zones.
Build custom automation or alert workflows around statistically unusual participation spikes.
Recommended Settings
Use on 1-minute chart for full MTF display.
Adjust the SMA length (default 20) and Z-Score threshold (default 3.0) to suit market volatility.
For scalping or high-frequency environments, disable the 10m layer to reduce visual clutter.
Credits
Developed by Jason Hyde
© 2025 — All rights reserved.
Designed for clarity, precision, and MTF-synchronized institutional volume detection.
開源腳本
秉持TradingView一貫精神,這個腳本的創作者將其設為開源,以便交易者檢視並驗證其功能。向作者致敬!您可以免費使用此腳本,但請注意,重新發佈代碼需遵守我們的社群規範。
免責聲明
這些資訊和出版物並非旨在提供,也不構成TradingView提供或認可的任何形式的財務、投資、交易或其他類型的建議或推薦。請閱讀使用條款以了解更多資訊。
免責聲明
這些資訊和出版物並非旨在提供,也不構成TradingView提供或認可的任何形式的財務、投資、交易或其他類型的建議或推薦。請閱讀使用條款以了解更多資訊。