OPEN-SOURCE SCRIPT
WMA 5/10/30/40/80/100
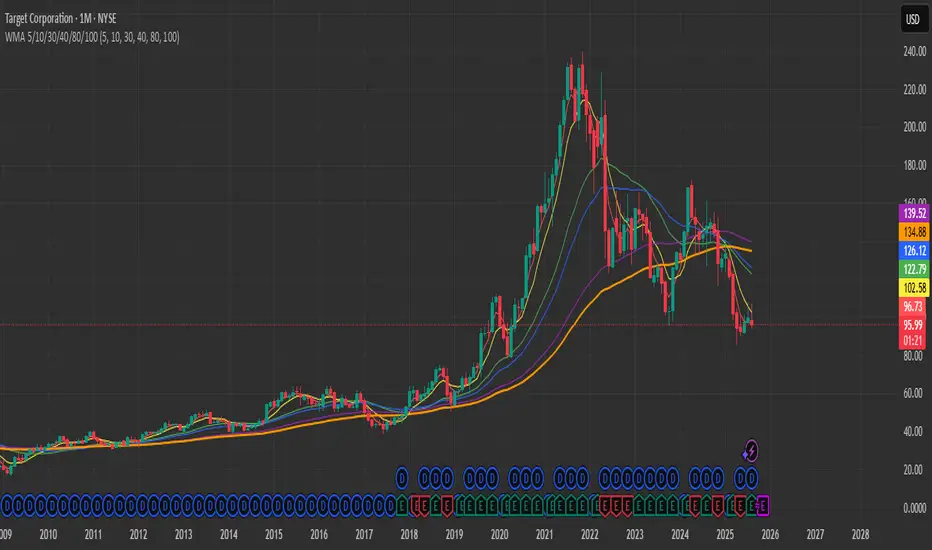
6 WMAs on the chart: 5, 10, 30, 40, 80, and 100 — each in its own color.
This indicator plots multiple Weighted Moving Averages (WMA) on the price chart: 5, 10, 30, 40, 80, and 100.
Shorter WMAs (5 & 10) react quickly to price changes and are useful for short-term trend detection.
Longer WMAs (30, 40, 80, 100) help identify medium- to long-term trends and dynamic support/resistance zones.
Traders often watch for crossovers between short-term and long-term WMAs as potential trade signals.
開源腳本
秉持TradingView一貫精神,這個腳本的創作者將其設為開源,以便交易者檢視並驗證其功能。向作者致敬!您可以免費使用此腳本,但請注意,重新發佈代碼需遵守我們的社群規範。
免責聲明
這些資訊和出版物並非旨在提供,也不構成TradingView提供或認可的任何形式的財務、投資、交易或其他類型的建議或推薦。請閱讀使用條款以了解更多資訊。
免責聲明
這些資訊和出版物並非旨在提供,也不構成TradingView提供或認可的任何形式的財務、投資、交易或其他類型的建議或推薦。請閱讀使用條款以了解更多資訊。