OPEN-SOURCE SCRIPT
Kaufman Trend Strength Signal

█ Overview
Kaufman Trend Strength Signal is an advanced trend detection tool that decomposes price action into its underlying directional trend and localized oscillation using a vector-based Kalman Filter.
By integrating adaptive smoothing and dynamic weighting via a weighted moving average (WMA), this indicator provides real-time insight into both trend direction and trend strength — something standard moving averages often fail to capture.
The core model assumes that observed price consists of two components:
(1) a directional trend, and
(2) localized noise or oscillation.
Using a two-step Predict & Update cycle, the filter continuously refines its trend estimate as new market data becomes available.

█ How It Works
This indicator employs a Kalman Filter model that separates the trend from short-term fluctuations in a price series.
█ Key Features
█ How to Use
█ Settings
█ Visual Guide

█ Best Practices
❗ Disclaimer
This script is provided for educational purposes only and should not be considered financial advice or a recommendation to buy/sell any asset.
Trading involves risk. Past performance does not guarantee future results.
Always perform your own analysis and use proper risk management when trading.
Kaufman Trend Strength Signal is an advanced trend detection tool that decomposes price action into its underlying directional trend and localized oscillation using a vector-based Kalman Filter.
By integrating adaptive smoothing and dynamic weighting via a weighted moving average (WMA), this indicator provides real-time insight into both trend direction and trend strength — something standard moving averages often fail to capture.
The core model assumes that observed price consists of two components:
(1) a directional trend, and
(2) localized noise or oscillation.
Using a two-step Predict & Update cycle, the filter continuously refines its trend estimate as new market data becomes available.
█ How It Works
This indicator employs a Kalman Filter model that separates the trend from short-term fluctuations in a price series.
- [] Predict & Update Cycle: With each new bar, the filter predicts the price state and updates that prediction using the latest observed price, producing a smooth but adaptive trend line.
[] Trend Strength Normalization: Internally, the oscillator component is normalized against recent values (N periods) to calculate a trend strength score between -100 and +100.
(Note: The oscillator is not plotted on the chart but is used for signal generation.)
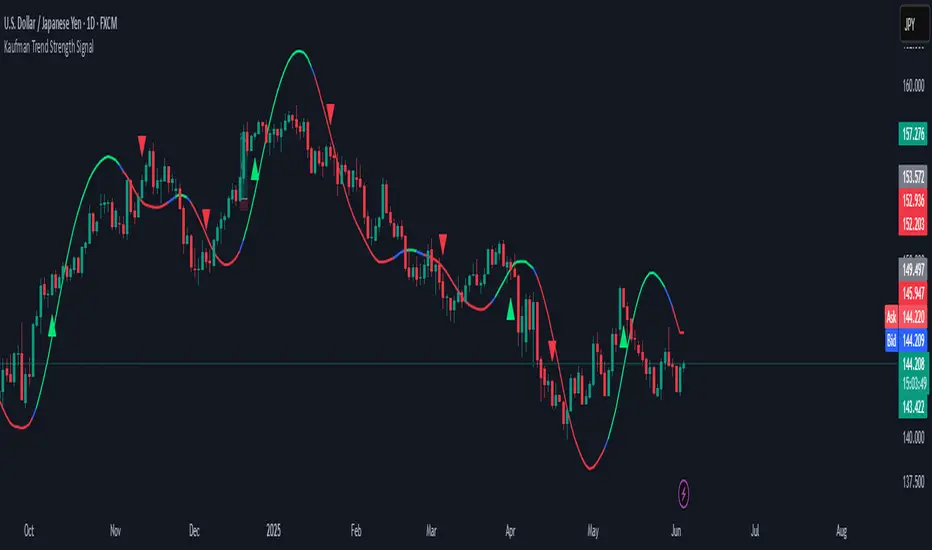
[] Filtered MA Line: The trend component is plotted as a smooth Kalman Filter-based moving average (MA) line on the main chart.
[] Threshold Cross Signals: When the internal trend strength crosses a user-defined threshold (default: ±60), visual entry arrows are displayed to signal momentum shifts.
█ Key Features
- [] Adaptive Trend Estimation: Real-time filtering that adjusts dynamically to market changes.
[] Visual Buy/Sell Signals: Entry arrows appear when the trend strength crosses above or below the configured threshold. - Built-in Range Filter: The MA line turns blue when trend strength is weak (|value| < 10), helping you filter out choppy, sideways conditions.
█ How to Use
- [] Trend Detection:
• Green MA = bullish trend
• Red MA = bearish trend
• Blue MA = no trend / ranging market
[] Entry Signals:
• Green triangle = trend strength crossed above +Threshold → potential bullish entry
• Red triangle = trend strength crossed below -Threshold → potential bearish entry
█ Settings
- [] Entry Threshold: Level at which the trend strength triggers entry signals (default: 60)
[] Process Noise 1 & 2: Control the filter’s responsiveness to recent price action. Higher = more reactive; lower = smoother.
[] Measurement Noise: Sets how much the filter "trusts" price data. High = smoother MA, low = faster response but more noise.
[] Trend Lookback (N2): Number of bars used to normalize trend strength. Lower = more sensitive; higher = more stable. - Trend Smoothness (R2): WMA smoothing applied to the trend strength calculation.
█ Visual Guide
- [] Green MA Line → Bullish trend
[] Red MA Line → Bearish trend
[] Blue MA Line → Sideways/range
[] Green Triangle → Entry signal (trend strengthening) - Red Triangle → Entry signal (trend weakening)
█ Best Practices
- [] In high-volatility conditions, increase Measurement Noise to reduce false signals.
[] Combine with other indicators (e.g., RSI, MACD, EMA) for confirmation and filtering. - Adjust "Entry Threshold" and noise settings depending on your timeframe and trading style.
❗ Disclaimer
This script is provided for educational purposes only and should not be considered financial advice or a recommendation to buy/sell any asset.
Trading involves risk. Past performance does not guarantee future results.
Always perform your own analysis and use proper risk management when trading.
開源腳本
秉持TradingView一貫精神,這個腳本的創作者將其設為開源,以便交易者檢視並驗證其功能。向作者致敬!您可以免費使用此腳本,但請注意,重新發佈代碼需遵守我們的社群規範。
免責聲明
這些資訊和出版物並非旨在提供,也不構成TradingView提供或認可的任何形式的財務、投資、交易或其他類型的建議或推薦。請閱讀使用條款以了解更多資訊。
開源腳本
秉持TradingView一貫精神,這個腳本的創作者將其設為開源,以便交易者檢視並驗證其功能。向作者致敬!您可以免費使用此腳本,但請注意,重新發佈代碼需遵守我們的社群規範。
免責聲明
這些資訊和出版物並非旨在提供,也不構成TradingView提供或認可的任何形式的財務、投資、交易或其他類型的建議或推薦。請閱讀使用條款以了解更多資訊。