OPEN-SOURCE SCRIPT
[KVA]Volume Impulse
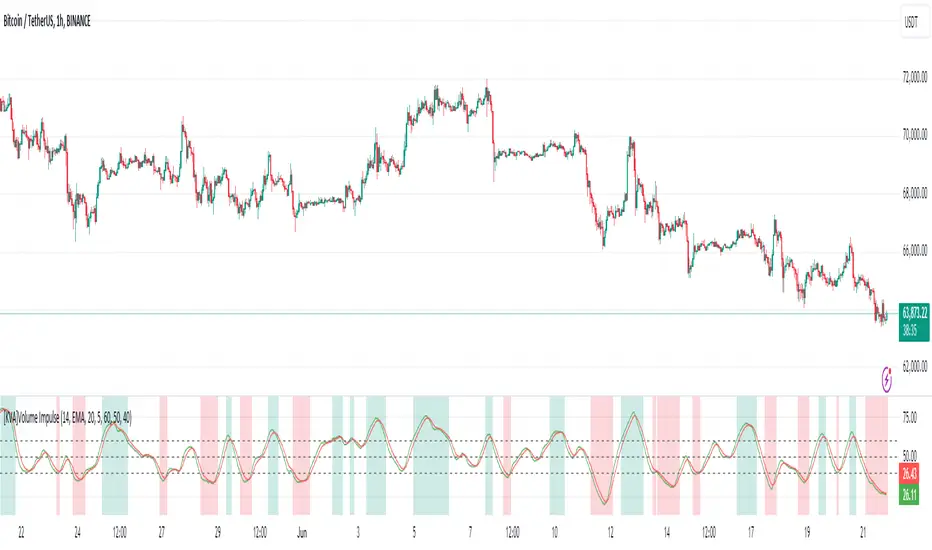
The [KVA] Volume Impulse indicator is designed to provide insights into market momentum by analyzing volume dynamics. It helps traders identify periods of strong buying and selling pressure, which can be crucial for making informed trading decisions.
What does the indicator do?
The [KVA] Volume Impulse indicator calculates positive and negative volume percentages based on the price range within each bar. It allows traders to visualize the distribution of volume and detect potential shifts in market sentiment.
How does it work?
The indicator uses a customizable lookback period to analyze volume data, smoothing the results with user-defined moving averages. By comparing the positive and negative volume percentages, the indicator highlights overbought and oversold conditions, aiding in trend detection and potential reversal points.
How to use it?
Identify Momentum: Use the positive and negative volume percentages to gauge market momentum within the specified lookback period.
Detect Overbought/Oversold Conditions: Look for the indicator crossing above the overbought level or below the oversold level to identify potential reversal points.
Smooth Trends: Adjust the moving average type and lengths to smooth out the volume data and identify trends more clearly.
Key Features
Inputs:
What does the indicator do?
The [KVA] Volume Impulse indicator calculates positive and negative volume percentages based on the price range within each bar. It allows traders to visualize the distribution of volume and detect potential shifts in market sentiment.
How does it work?
The indicator uses a customizable lookback period to analyze volume data, smoothing the results with user-defined moving averages. By comparing the positive and negative volume percentages, the indicator highlights overbought and oversold conditions, aiding in trend detection and potential reversal points.
How to use it?
Identify Momentum: Use the positive and negative volume percentages to gauge market momentum within the specified lookback period.
Detect Overbought/Oversold Conditions: Look for the indicator crossing above the overbought level or below the oversold level to identify potential reversal points.
Smooth Trends: Adjust the moving average type and lengths to smooth out the volume data and identify trends more clearly.
Key Features
- [] Volume Analysis: Calculates the positive and negative volume based on the price range within each bar.
[] Lookback Period: Allows you to define a lookback period over which the indicator calculations are performed, providing flexibility in analyzing different timeframes.
[] Customizable Moving Averages: Choose from various types of moving averages (EMA, SMA, WMA, Hull) to smooth the volume data.
[] Overbought/Oversold Levels: Visual markers for overbought, middle, and oversold conditions to help identify potential reversal points.
[] Color-Coded Areas: Highlights overbought and oversold regions with customizable colors for easy visual interpretation.
[] Plotting Options: Displays the positive volume and its smoothed version using the selected moving average type and length.
Inputs:
- [] Lookback Period: Define the period over which the volume analysis is performed.
[] Moving Average Type: Select the type of moving average (EMA, SMA, WMA, Hull) to be applied.
[] Moving Average Length: Set the length for the primary moving average.
[] Smooth Length: Define the length for the smoothed moving average.
[] Overbought Level: Set the threshold for overbought conditions.
[] Middle Level: Set the threshold for middle conditions.
[] Oversold Level: Set the threshold for oversold conditions.
[] Color Settings: Customize the colors for overbought and oversold areas and their respective fill colors.
開源腳本
秉持TradingView一貫精神,這個腳本的創作者將其設為開源,以便交易者檢視並驗證其功能。向作者致敬!您可以免費使用此腳本,但請注意,重新發佈代碼需遵守我們的社群規範。
免責聲明
這些資訊和出版物並非旨在提供,也不構成TradingView提供或認可的任何形式的財務、投資、交易或其他類型的建議或推薦。請閱讀使用條款以了解更多資訊。
免責聲明
這些資訊和出版物並非旨在提供,也不構成TradingView提供或認可的任何形式的財務、投資、交易或其他類型的建議或推薦。請閱讀使用條款以了解更多資訊。