OPEN-SOURCE SCRIPT
Alpha Performance of Period
Alpha Performance of Period (PoP) produces a visualization of returns (gains and losses) over a quarterly, monthly, or annual period. It also displays the total % gain and loss over any length of days, months, and years as defined by the user.
Performance of Period (PoP) can be used to understand the performance of an asset over multiple periods using a single chart layout, and to compare the performance of different assets by using a multi-chart layout.
This can, for example, be used to compare the NASDAQ, S&P, and DJI over the past 20 years to create a dow vs. nasdaq vs. s&p performance chart. This can help you understand a comparison of historical returns by showing which performs the best month-over-month, quarter-to-quarter, year-to-year, throughout any custom period of days/months/years.
The ability to get a visualization of the % gain/loss can help to better understand how markets have performed over time and which markets have historically performed the best.
Check out the up and coming Educational Idea we will be releasing soon after this is live to see an example of how we use this tool.
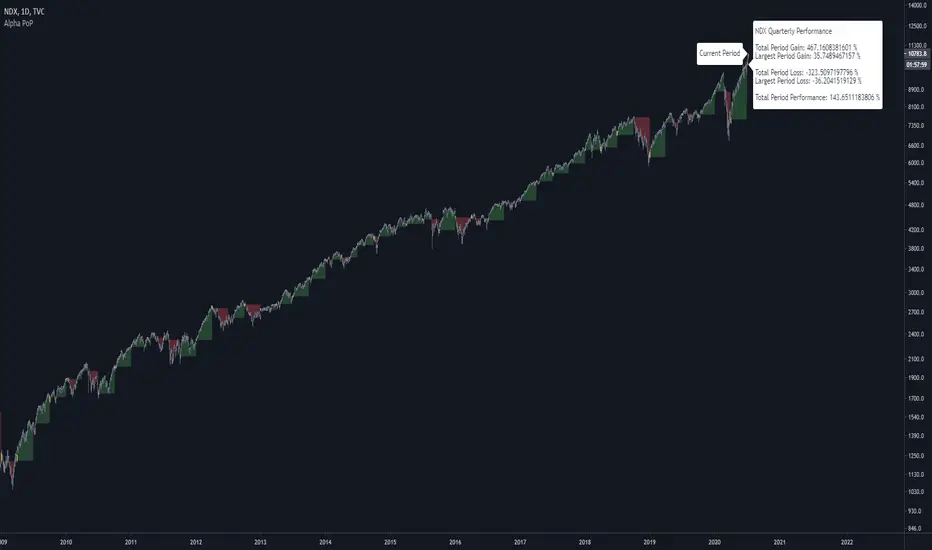
Current Period Label[/I]
-----
Current Period: This label shows the current period's performance only when you hover over it.
(This label is located to the left of the current period's open candle and at the current candles close price)
TICKER "Time Period" Performance Label[/I]
-----
Total Period Gain: The total of all % gain periods from the start to end date.
Largest Period Gain: The biggest % gain period from the start to end date.
Total Period Loss: The total of all % loss periods from the start to end date.
Largest Period Loss: The biggest % loss period from the start to end date.
Total period Performance: The total % performance, the difference between the total gain and total loss.
NOTE[/I]: The "Current Period" performance is excluded from ALL five of the above-mentioned figures. This was done to avoid giving inaccurate comparison figures due to the period not being finished yet.
Inputs[/I]
-----
Current Script Version + Info: A drop-down list of instructions for the user to refer to.
Dark Mode Labels: Toggle on for Dark Mode. This is done since Labels text and background color can not be adjusted separately within the visual inputs so this is the best fit solution.
Time Period of Returns: Pick the period of performance you would like to emulate monthly/quarterly/annual.
Start Date: The day to start tracking performance.
Start Month: The month to start tracking performance.
Start Year: The year to start tracking performance.
End Date: The day to stop tracking performance.
End Month: The month to stop tracking performance.
End Year: The year to stop tracking performance.
As always if you have any feedback let us know in the comments and leave a like if you enjoy this tool :)[/I]
Performance of Period (PoP) can be used to understand the performance of an asset over multiple periods using a single chart layout, and to compare the performance of different assets by using a multi-chart layout.
This can, for example, be used to compare the NASDAQ, S&P, and DJI over the past 20 years to create a dow vs. nasdaq vs. s&p performance chart. This can help you understand a comparison of historical returns by showing which performs the best month-over-month, quarter-to-quarter, year-to-year, throughout any custom period of days/months/years.
The ability to get a visualization of the % gain/loss can help to better understand how markets have performed over time and which markets have historically performed the best.
Check out the up and coming Educational Idea we will be releasing soon after this is live to see an example of how we use this tool.
Current Period Label[/I]
-----
Current Period: This label shows the current period's performance only when you hover over it.
(This label is located to the left of the current period's open candle and at the current candles close price)
TICKER "Time Period" Performance Label[/I]
-----
Total Period Gain: The total of all % gain periods from the start to end date.
Largest Period Gain: The biggest % gain period from the start to end date.
Total Period Loss: The total of all % loss periods from the start to end date.
Largest Period Loss: The biggest % loss period from the start to end date.
Total period Performance: The total % performance, the difference between the total gain and total loss.
NOTE[/I]: The "Current Period" performance is excluded from ALL five of the above-mentioned figures. This was done to avoid giving inaccurate comparison figures due to the period not being finished yet.
Inputs[/I]
-----
Current Script Version + Info: A drop-down list of instructions for the user to refer to.
Dark Mode Labels: Toggle on for Dark Mode. This is done since Labels text and background color can not be adjusted separately within the visual inputs so this is the best fit solution.
Time Period of Returns: Pick the period of performance you would like to emulate monthly/quarterly/annual.
Start Date: The day to start tracking performance.
Start Month: The month to start tracking performance.
Start Year: The year to start tracking performance.
End Date: The day to stop tracking performance.
End Month: The month to stop tracking performance.
End Year: The year to stop tracking performance.
As always if you have any feedback let us know in the comments and leave a like if you enjoy this tool :)[/I]
開源腳本
本著TradingView的真正精神,此腳本的創建者將其開源,以便交易者可以查看和驗證其功能。向作者致敬!雖然您可以免費使用它,但請記住,重新發佈程式碼必須遵守我們的網站規則。
免責聲明
這些資訊和出版物並不意味著也不構成TradingView提供或認可的金融、投資、交易或其他類型的意見或建議。請在使用條款閱讀更多資訊。
開源腳本
本著TradingView的真正精神,此腳本的創建者將其開源,以便交易者可以查看和驗證其功能。向作者致敬!雖然您可以免費使用它,但請記住,重新發佈程式碼必須遵守我們的網站規則。
免責聲明
這些資訊和出版物並不意味著也不構成TradingView提供或認可的金融、投資、交易或其他類型的意見或建議。請在使用條款閱讀更多資訊。