OPEN-SOURCE SCRIPT
PSDI
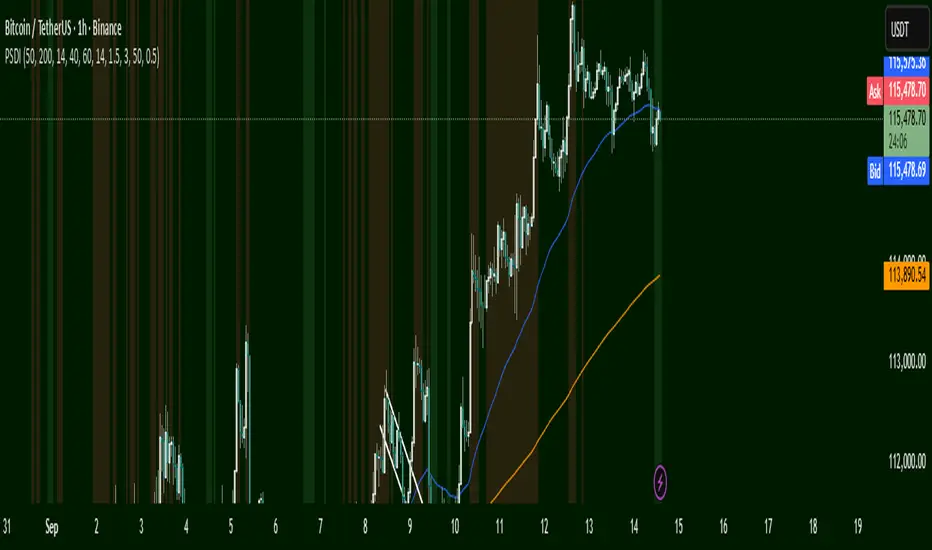
Green Zone → Potential Buy Area
Price is near support.
Red Zone → Potential Sell Area
Price is near resistance.
EMA Lines
Blue (EMA50) above Orange (EMA200): Trend up → favors buys.
Blue below Orange: Trend down → favors sells.
How to Use
Look at zones and trend.
Price near green + trend up → consider long.
Price near red + trend down → consider short.
NOTE: When in uptrend, only follow green zones. When in down trend only follow red zones.
開源腳本
秉持TradingView一貫精神,這個腳本的創作者將其設為開源,以便交易者檢視並驗證其功能。向作者致敬!您可以免費使用此腳本,但請注意,重新發佈代碼需遵守我們的社群規範。
免責聲明
這些資訊和出版物並非旨在提供,也不構成TradingView提供或認可的任何形式的財務、投資、交易或其他類型的建議或推薦。請閱讀使用條款以了解更多資訊。
開源腳本
秉持TradingView一貫精神,這個腳本的創作者將其設為開源,以便交易者檢視並驗證其功能。向作者致敬!您可以免費使用此腳本,但請注意,重新發佈代碼需遵守我們的社群規範。
免責聲明
這些資訊和出版物並非旨在提供,也不構成TradingView提供或認可的任何形式的財務、投資、交易或其他類型的建議或推薦。請閱讀使用條款以了解更多資訊。