OPEN-SOURCE SCRIPT
Breakout Swing High Low
This open-source indicator identifies swing high and swing low breakouts, providing clear visual signals for potential trend entries. It is designed for traders who use price action to spot breakout opportunities in trending markets.
How It Works
Swing Detection: The indicator uses a user-defined lookback period (default: 4 candles) to identify swing highs (peaks) and swing lows (troughs). A swing high is confirmed when a candle's high is higher than the surrounding candles, and a swing low is confirmed when a candle's low is lower.
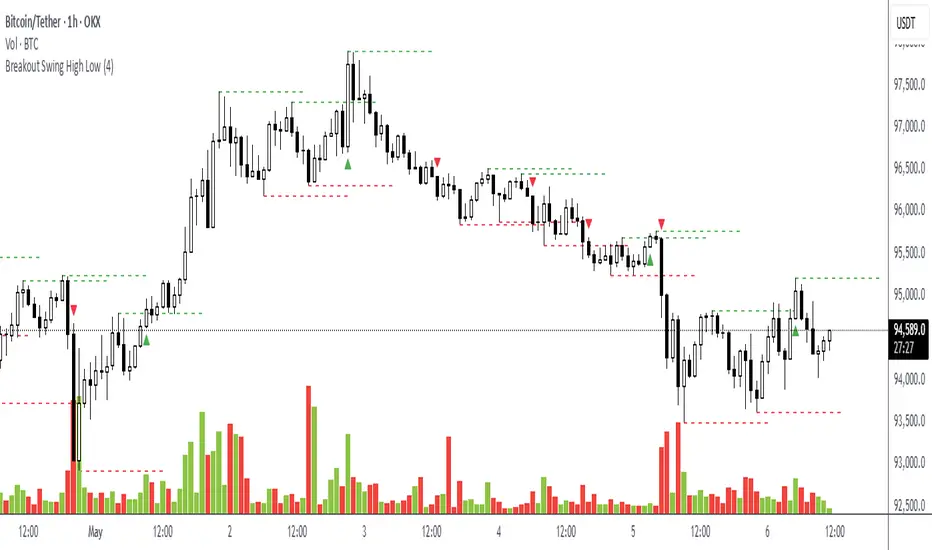
Breakout Signals: A green triangle below the candle signals a breakout above the most recent swing high, indicating a potential buy opportunity. A red triangle above the candle signals a breakout below the most recent swing low, indicating a potential sell opportunity. Each swing level triggers only one breakout signal to avoid clutter.
Visualization: Swing high levels are drawn as green dashed lines, and swing low levels as red dashed lines, extending 15 candles for clarity. Breakout signals are marked with small triangles.
How to Use
Apply the Indicator: Add the indicator to your TradingView chart.
Adjust Lookback: Set the "Lookback Candles" input (default: 4) to control the sensitivity of swing detection. Smaller values detect shorter-term swings, while larger values identify more significant levels.
Interpret Signals:
Green triangle (below candle): Consider a buy opportunity when price breaks above a swing high.
Red triangle (above candle): Consider a sell opportunity when price breaks below a swing low.
Combine with Other Tools: Use in conjunction with trend indicators (e.g., 50-period EMA) or support/resistance levels to filter signals in trending markets.
Timeframes: Works best on higher timeframes (e.g., 1H, 4H) in trending markets to avoid false breakouts in sideways conditions.
How It Works
Swing Detection: The indicator uses a user-defined lookback period (default: 4 candles) to identify swing highs (peaks) and swing lows (troughs). A swing high is confirmed when a candle's high is higher than the surrounding candles, and a swing low is confirmed when a candle's low is lower.
Breakout Signals: A green triangle below the candle signals a breakout above the most recent swing high, indicating a potential buy opportunity. A red triangle above the candle signals a breakout below the most recent swing low, indicating a potential sell opportunity. Each swing level triggers only one breakout signal to avoid clutter.
Visualization: Swing high levels are drawn as green dashed lines, and swing low levels as red dashed lines, extending 15 candles for clarity. Breakout signals are marked with small triangles.
How to Use
Apply the Indicator: Add the indicator to your TradingView chart.
Adjust Lookback: Set the "Lookback Candles" input (default: 4) to control the sensitivity of swing detection. Smaller values detect shorter-term swings, while larger values identify more significant levels.
Interpret Signals:
Green triangle (below candle): Consider a buy opportunity when price breaks above a swing high.
Red triangle (above candle): Consider a sell opportunity when price breaks below a swing low.
Combine with Other Tools: Use in conjunction with trend indicators (e.g., 50-period EMA) or support/resistance levels to filter signals in trending markets.
Timeframes: Works best on higher timeframes (e.g., 1H, 4H) in trending markets to avoid false breakouts in sideways conditions.
開源腳本
秉持TradingView一貫精神,這個腳本的創作者將其設為開源,以便交易者檢視並驗證其功能。向作者致敬!您可以免費使用此腳本,但請注意,重新發佈代碼需遵守我們的社群規範。
免責聲明
這些資訊和出版物並非旨在提供,也不構成TradingView提供或認可的任何形式的財務、投資、交易或其他類型的建議或推薦。請閱讀使用條款以了解更多資訊。
免責聲明
這些資訊和出版物並非旨在提供,也不構成TradingView提供或認可的任何形式的財務、投資、交易或其他類型的建議或推薦。請閱讀使用條款以了解更多資訊。