PROTECTED SOURCE SCRIPT
已更新 #TheStrat Based Sector Rotation on an intraday basis
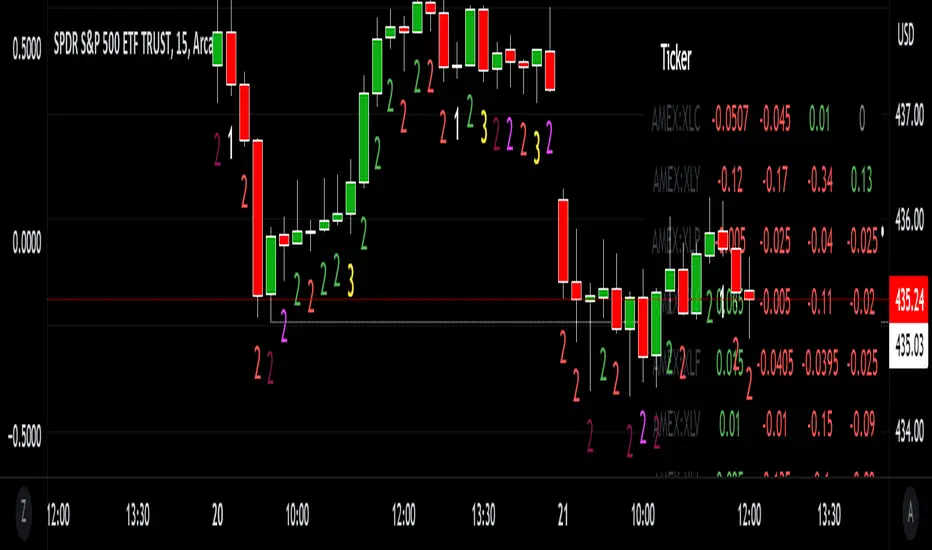
This script will show the close to close change on any timeframe it is set to across all the SPDR sector selectors [minus 1 because tradingview limits to 40!]
Green colors dictate a positive close to close change on the specified timeframe.
Red colors dictate a negative close to close change on the specified timeframe.
When all of the values flip red or a wave of red or green begins to come over it signals a move that is supported by all of the underlying components of the SPY. This is important to know because when you get a simultaneous break [#TheStrat term] you will then have aggressive participants. This is because the whole market is moving the same, meaning 'the big boys' are buying or selling everything all at once! When that happens the moves are much greater.
Tickers can be changed in settings, OF NOTE. When a ticker is changed the table cell name will not change. I have not found a way to use ticker names in the table cells so just will be a quirk for now.
發行說明
This update changes data to be portrayed from oldest to newest in a left to right fashion on the dashboard.受保護腳本
此腳本以閉源形式發佈。 不過,您可以自由使用,沒有任何限制 — 點擊此處了解更多。
免責聲明
這些資訊和出版物並非旨在提供,也不構成TradingView提供或認可的任何形式的財務、投資、交易或其他類型的建議或推薦。請閱讀使用條款以了解更多資訊。
受保護腳本
此腳本以閉源形式發佈。 不過,您可以自由使用,沒有任何限制 — 點擊此處了解更多。
免責聲明
這些資訊和出版物並非旨在提供,也不構成TradingView提供或認可的任何形式的財務、投資、交易或其他類型的建議或推薦。請閱讀使用條款以了解更多資訊。