OPEN-SOURCE SCRIPT
已更新 Trend Master
Notes:
Tradingview has strict house rules of not allowing Heikin Ashi charts (and others beside normal price chart) to be used together with the indicator for trend analysis.
However, there may be users already using previous version of Trend Master but unfortunately has been hidden by Tradingview.
In view of this I decided to re-post the updated version, with the use of normal price chart only. Hope this help.
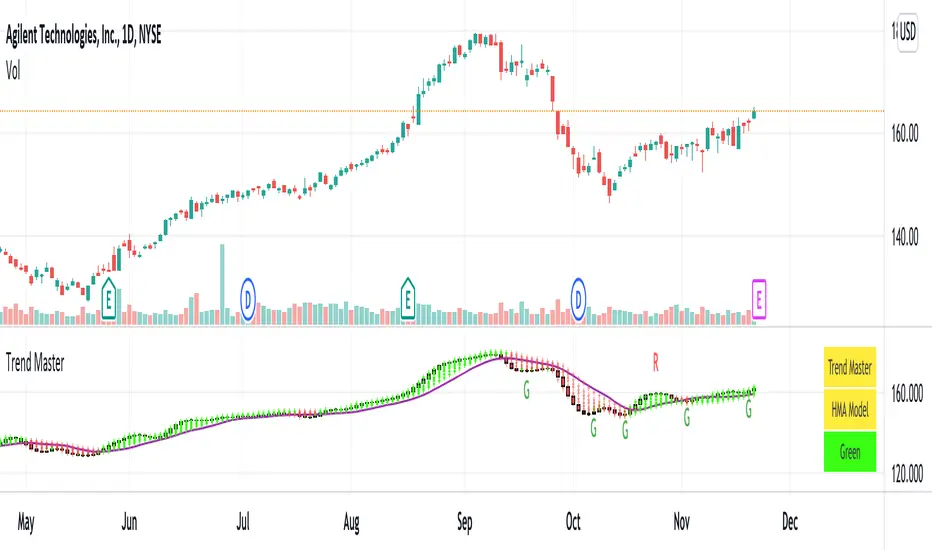
1. Trend Master, an indicator for trend analysis with the use of normal price chart.
2. Trend Master candle is in the form of solid candle without upper and lower tails.
The candle is in green color during an uptrend and red color during a downtrend.
When candle changes from red color to green color, it may signify the potential change from a down trend to an uptrend, vice versa.
3. Users can select the trend analysis model as they see fit, namely EMA , SMA , WMA and HMA .
4. Moving average lines of Trend Master are also included. Default is SMA13, the rest are SMA5, SMA21.
5. Users can turn on Rainbows if needed, it may help to detect the small changes of trend, if any.
6. A table of Indicator Name, Trend Model and Trend status is included. User can turn on to see the details.
Comments are welcome to further improve the accuracy of indicator that will benefit public users. Hope this help.
Disclaimer : attached chart is for the purpose of illustrating the indicator, no recommendation on buy/sell
Tradingview has strict house rules of not allowing Heikin Ashi charts (and others beside normal price chart) to be used together with the indicator for trend analysis.
However, there may be users already using previous version of Trend Master but unfortunately has been hidden by Tradingview.
In view of this I decided to re-post the updated version, with the use of normal price chart only. Hope this help.
1. Trend Master, an indicator for trend analysis with the use of normal price chart.
2. Trend Master candle is in the form of solid candle without upper and lower tails.
The candle is in green color during an uptrend and red color during a downtrend.
When candle changes from red color to green color, it may signify the potential change from a down trend to an uptrend, vice versa.
3. Users can select the trend analysis model as they see fit, namely EMA , SMA , WMA and HMA .
4. Moving average lines of Trend Master are also included. Default is SMA13, the rest are SMA5, SMA21.
5. Users can turn on Rainbows if needed, it may help to detect the small changes of trend, if any.
6. A table of Indicator Name, Trend Model and Trend status is included. User can turn on to see the details.
Comments are welcome to further improve the accuracy of indicator that will benefit public users. Hope this help.
Disclaimer : attached chart is for the purpose of illustrating the indicator, no recommendation on buy/sell
發行說明
revision 2, 22Nov21, convert to scripts version 5. Table size adjustable. Allow input on Trend Moving Average Length. 開源腳本
秉持TradingView一貫精神,這個腳本的創作者將其設為開源,以便交易者檢視並驗證其功能。向作者致敬!您可以免費使用此腳本,但請注意,重新發佈代碼需遵守我們的社群規範。
免責聲明
這些資訊和出版物並非旨在提供,也不構成TradingView提供或認可的任何形式的財務、投資、交易或其他類型的建議或推薦。請閱讀使用條款以了解更多資訊。
免責聲明
這些資訊和出版物並非旨在提供,也不構成TradingView提供或認可的任何形式的財務、投資、交易或其他類型的建議或推薦。請閱讀使用條款以了解更多資訊。