OPEN-SOURCE SCRIPT
已更新 MinMax(20,50,100, 200)
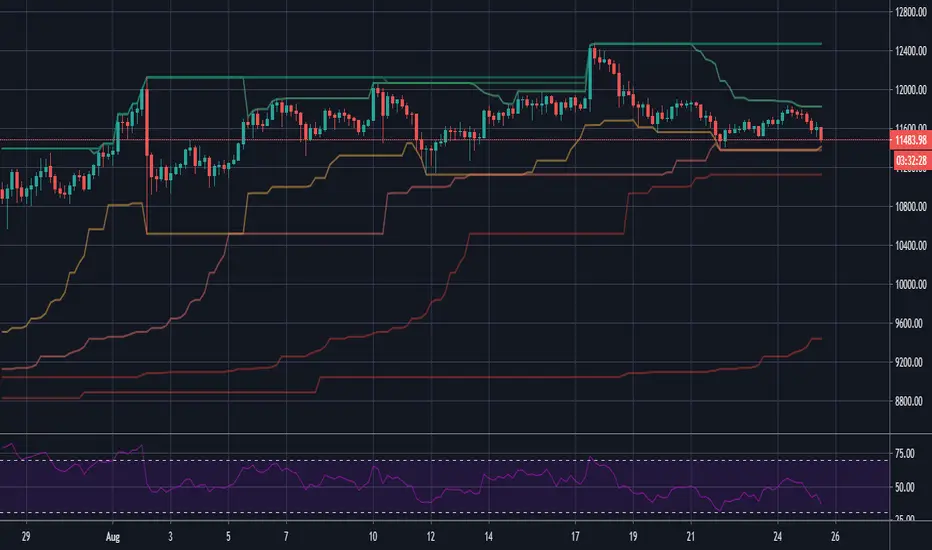
Draws minimum and maximum prices as a line chart for four different time frames.
1) The last 21 bars (close price)
2) The last 50 bars (close price)
3) The last 100 bars (close price)
4) The last 200 bars (close price)
Min/ Max values usually provide important resistance/ support levels.
1) The last 21 bars (close price)
2) The last 50 bars (close price)
3) The last 100 bars (close price)
4) The last 200 bars (close price)
Min/ Max values usually provide important resistance/ support levels.
發行說明
Added the 100th min/ max series.開源腳本
秉持TradingView一貫精神,這個腳本的創作者將其設為開源,以便交易者檢視並驗證其功能。向作者致敬!您可以免費使用此腳本,但請注意,重新發佈代碼需遵守我們的社群規範。
免責聲明
這些資訊和出版物並非旨在提供,也不構成TradingView提供或認可的任何形式的財務、投資、交易或其他類型的建議或推薦。請閱讀使用條款以了解更多資訊。
開源腳本
秉持TradingView一貫精神,這個腳本的創作者將其設為開源,以便交易者檢視並驗證其功能。向作者致敬!您可以免費使用此腳本,但請注意,重新發佈代碼需遵守我們的社群規範。
免責聲明
這些資訊和出版物並非旨在提供,也不構成TradingView提供或認可的任何形式的財務、投資、交易或其他類型的建議或推薦。請閱讀使用條款以了解更多資訊。