OPEN-SOURCE SCRIPT
Ehlers Data Sampling Relative Strength Indicator [CC]
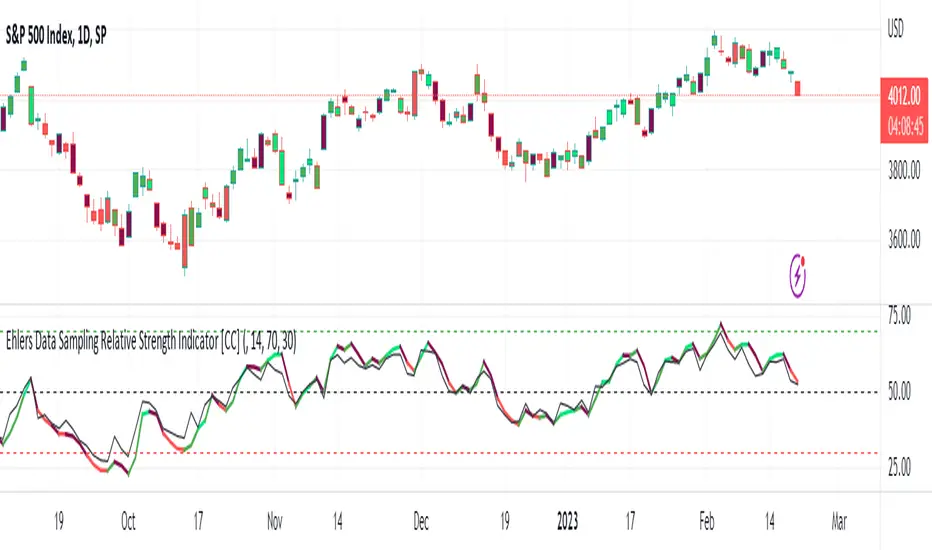
The Data Sampling Indicator was created by John Ehlers (Stocks and Commodities Mar 2023) and this is a genius method to reduce noise in the market data but also doesn't introduce any lag while doing so. The way this works is because traditionally, people have always relied on the close price as the default input for many indicators such as the RSI or MACD as examples. Since the open is usually virtually identical to the previous close, it has been ignored by most people but Ehlers discovered that if you do a simple average of open and close for the input on any indicator, you can remove much of the noise without any added lag. I have used the RSI as he did in his example and plotted both to show the difference between the traditional RSI and using Ehlers' process as the new Data Sampling RSI. You can clearly see that this new RSI follows the price fluctuations much closer and is much smoother than the traditional RSI. As usual, I have included different colors to show the strength of the buy or sell signals so darker colors mean it is a very strong signal and lighter colors means it is a normal signal. Buy when the line turns green and sell when it turns red.
Feel free to try out this method to replace the input for any indicator and let me know how this works for you! And of course let me know if you would like me to publish any indicator script.
Feel free to try out this method to replace the input for any indicator and let me know how this works for you! And of course let me know if you would like me to publish any indicator script.
開源腳本
本著TradingView的真正精神,此腳本的創建者將其開源,以便交易者可以查看和驗證其功能。向作者致敬!雖然您可以免費使用它,但請記住,重新發佈程式碼必須遵守我們的網站規則。
I created the largest stock indicator library:
github.com/ooples/
Custom Indicator Requests:
forms.gle/ouMffZR3dQ8bSJQG7
Tips are appreciated:
paypal.me/cheatcountry
patreon.com/cheatcountry
github.com/ooples/
Custom Indicator Requests:
forms.gle/ouMffZR3dQ8bSJQG7
Tips are appreciated:
paypal.me/cheatcountry
patreon.com/cheatcountry
免責聲明
這些資訊和出版物並不意味著也不構成TradingView提供或認可的金融、投資、交易或其他類型的意見或建議。請在使用條款閱讀更多資訊。