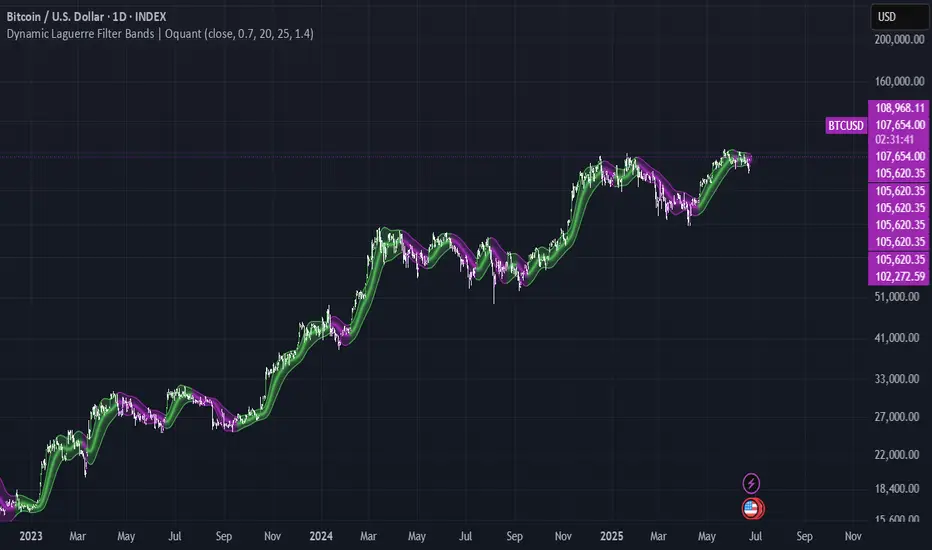
Dynamic Laguerre Filter Bands | OttoThis indicator combines trend-following and volatility analysis by enhancing the traditional Laguerre filter with a dynamic, volatility-adjusted band system. Instead of using fixed thresholds, the bands adapt in real-time to changing market conditions by applying smoothed standard deviation calculations. This design keeps the indicator responsive to significant price movements while effectively filtering out short-term market noise, resulting in more accurate trend identification and breakout signals.
Core Concept
The indicator is built around the following key components:
Laguerre Filter:
The Laguerre filter is designed to smooth out price data by reducing market noise while still being quick enough to detect real changes in price direction. Its goal is to create a clear, smooth trend line that helps traders/investors focus on the overall market trend without getting distracted by small, random price swings.
It uses a parameter called gamma to control how it balances smoothness and responsiveness:
A lower gamma gives more weight to recent price data, making the filter react faster to new price changes. This means the trend line is more sensitive but may also be less smooth and more prone to small fluctuations.
A higher gamma gives more weight to past price data, making the filter smoother and less sensitive to quick changes. This helps reduce noise and produces a steadier trend line, but it also introduces more lag, meaning the filter reacts slower to new price moves.
By adjusting gamma, the Laguerre filter lets you choose the balance between following price changes quickly and having a stable, noise-free trend signal.
Standard Deviation:
shows how much price varies from the mean. In this indicator, it’s used to measure market volatility.
Volatility Bands: The upper and lower bands are based on an EMA-smoothed standard deviation of price. The EMA reduces sudden jumps in volatility, creating smoother and more stable bands that still respond to changing market conditions. These bands are plotted around the Laguerre filter line, expanding and contracting in a controlled way to stay aligned with real market movement while avoiding short-term noise.
Signal Logic:
A long signal is triggered when the close price crosses above the upper band.
A short signal occurs when the close price falls below the lower band.
⚙️ Inputs
Source: Price source used in calculations
Gamma: Adjusts how much the Laguerre filter responds to price changes. Lower gamma values make the filter react more to recent prices, while higher values give more influence to older data, making the line smoother but slower to respond.
Volatility Length: Period used to calculate standard deviation
Volatility Smoothing Length: EMA smoothing length for standard deviation
Multiplier: Scales the width of the bands based on volatility
📈 Visual Output
Laguerre Filter Line: Plots the laguerre filter line, colored dynamically based on signal direction (green for bullish, purple for bearish)
Upper & Lower Bands: Volatility-based bands that adjust with market conditions. (green for bullish, purple for bearish)
Glow Effect: Optional glow layer to enhance visibility of the laguerre filter trend line (green for bullish, purple for bearish)
Bar Coloring: Candlesticks and bar colors reflect the active signal state for fast visual interpretation (green for bullish, purple for bearish)
How to Use
Apply the indicator to your chart and monitor for signal events:
Long Signal: When price closes above the upper band
Short Signal: When price closes below the lower band
🔔 Alerts
This indicator supports optional alert conditions you can enable for:
Long Signal: Close price crossing above the upper band
Short Signal: Close price crossing below the lower band
⚠️ Disclaimer:
This indicator is intended for educational and informational purposes only. Trading/investing involves risk, and past performance does not guarantee future results. Always test and evaluate indicators/strategies before applying them in live markets. Use at your own risk.
Smoothing
FVG Trailing Stop [LuxAlgo]The FVG Trailing Stop indicator tracks unmitigated Fair Value Gaps (FVG) data to produce a Trailing Stop indicator able to determine if the market is uptrending or downtrending easily.
🔶 USAGE
The FVG Trailing Stop is intended to identify trend directions through its position relative to the closing price:
Bullish: Price is located above the Trailing Stop, indicating that all Bearish FVGs have been mitigated and the trend is anticipated to continue upwards.
Bearish State: Price is located below the Trailing Stop, indicating that all Bullish FVGs have been mitigated and the trend is anticipated to continue downwards.
The Trailing Stop originates from two extremities obtained from the average of respective unmitigated FVGs. The specific directional average is also displayed as a more transparent secondary line, however, the trailing stop is derived from this value and a new trend will not be detected until the opposite directional average is crossed.
Price reaching the Trailing Stop is caused by retracements and can lead to the following scenarios:
Outcome 1: The directional average is crossed next, indicating a new trend direction.
Outcome 2: The directional average is held as support or resistance, leading to a new impulse and a continuation of the trend.
🔹 Reset on Cross
While price crossing the Trailing Stop should be considered as a sign of an upcoming trend change; it is possible for the price to still evolve outside it.
As a solution, we have included the "Reset on Cross" feature, which (as the name suggests) hides and resets the Trailing Stop each time it is crossed, leading to a "Neutral" state.
This opens the opportunity for the Trailing Stop to be displayed again once the price moves again in the direction of the pre-established trend. A trader might use this to accumulate positions within a specific trend.
🔶 DETAILS
The script uses a typical identification method for FVGs. Once identified, the script collects the point of the FVG farthest from the current price when formed.
For Upwards FVGs this is the bottom of the FVG.
For Downwards FVGs this is the top of the FVG.
The data is managed only to use the last input lookback of FVGs. If an FVG is mitigated, it frees up a spot in the memory for a new FVG, however, if the lookback is full, the oldest will be deleted.
From there, it uses a "trailing" logic only to move the Trailing Stop in one direction until the trailing stop resets or the direction flips.
The extremities used to calculate the Trailing Stop are created from 2 calculation steps, the first step involves taking the raw average of the FVG mitigation levels, and the second step applies a simple moving average (SMA) smoothing of the precedent-obtained averages.
🔶 SETTINGS
Unmitigated FVG Lookback: Sets the maximum number of Unmitigated FVGs that the script will use.
Smoothing Length: Sets the smoothing length for the Trailing Stop to reduce erratic results.
Reset on Cross: When enabled, hide and reset the Trailing Stop until the price starts moving in the pre-established trend direction again.

Candle Breakout Oscillator [LuxAlgo]The Candle Breakout Oscillator tool allows traders to identify the strength and weakness of the three main market states: bullish, bearish, and choppy.
Know who controls the market at any given moment with an oscillator display with values ranging from 0 to 100 for the three main plots and upper and lower thresholds of 80 and 20 by default.
🔶 USAGE
The Candle Breakout Oscillator represents the three main market states, with values ranging from 0 to 100. By default, the upper and lower thresholds are set at 80 and 20, and when a value exceeds these thresholds, a colored area is displayed for the trader's convenience.
This tool is based on pure price action breakouts. In this context, we understand a breakout as a close above the last candle's high or low, which is representative of market strength. All other close positions in relation to the last candle's limits are considered weakness.
So, when the bullish plot (in green) is at the top of the oscillator (values above 80), it means that the bullish breakouts (close below the last candle low) are at their maximum value over the calculation window, indicating an uptrend. The same interpretation can be made for the bearish plot (in red), indicating a downtrend when high.
On the other hand, weakness is indicated when values are below the lower threshold (20), indicating that breakouts are at their minimum over the last 100 candles. Below are some examples of the possible main interpretations:
There are three main things to look for in this oscillator:
Value reaches extreme
Value leaves extreme
Bullish/Bearish crossovers
As we can see on the chart, before the first crossover happens the bears come out of strength (top) and the bulls come out of weakness (bottom), then after the crossover the bulls reach strength (top) and the bears weakness (bottom), this process is repeated in reverse for the second crossover.
The other main feature of the oscillator is its ability to identify periods of sideways trends when the sideways values have upper readings above 80, and trending behavior when the sideways values have lower readings below 20. As we just saw in the case of bullish vs. bearish, sideways values signal a change in behavior when reaching or leaving the extremes of the oscillator.
🔶 DETAILS
🔹 Data Smoothing
The tool offers up to 10 different smoothing methods. In the chart above, we can see the raw data (smoothing: None) and the RMA, TEMA, or Hull moving averages.
🔹 Data Weighting
Users can add different weighting methods to the data. As we can see in the image above, users can choose between None, Volume, or Price (as in Price Delta for each breakout).
🔶 SETTINGS
Window: Execution window, 100 candles by default
🔹 Data
Smoothing Method: Choose between none or ten moving averages
Smoothing Length: Length for the moving average
Weighting Method: Choose between None, Volume, or Price
🔹 Thresholds
Top: 80 by default
Bottom: 20 by default

Half Causal EstimatorOverview
The Half Causal Estimator is a specialized filtering method that provides responsive averages of market variables (volume, true range, or price change) with significantly reduced time delay compared to traditional moving averages. It employs a hybrid approach that leverages both historical data and time-of-day patterns to create a timely representation of market activity while maintaining smooth output.
Core Concept
Traditional moving averages suffer from time lag, which can delay signals and reduce their effectiveness for real-time decision making. The Half Causal Estimator addresses this limitation by using a non-causal filtering method that incorporates recent historical data (the causal component) alongside expected future behavior based on time-of-day patterns (the non-causal component).
This dual approach allows the filter to respond more quickly to changing market conditions while maintaining smoothness. The name "Half Causal" refers to this hybrid methodology—half of the data window comes from actual historical observations, while the other half is derived from time-of-day patterns observed over multiple days. By incorporating these "future" values from past patterns, the estimator can reduce the inherent lag present in traditional moving averages.
How It Works
The indicator operates through several coordinated steps. First, it stores and organizes market data by specific times of day (minutes/hours). Then it builds a profile of typical behavior for each time period. For calculations, it creates a filtering window where half consists of recent actual data and half consists of expected future values based on historical time-of-day patterns. Finally, it applies a kernel-based smoothing function to weight the values in this composite window.
This approach is particularly effective because market variables like volume, true range, and price changes tend to follow recognizable intraday patterns (they are positive values without DC components). By leveraging these patterns, the indicator doesn't try to predict future values in the traditional sense, but rather incorporates the average historical behavior at those future times into the current estimate.
The benefit of using this "average future data" approach is that it counteracts the lag inherent in traditional moving averages. In a standard moving average, recent price action is underweighted because older data points hold equal influence. By incorporating time-of-day averages for future periods, the Half Causal Estimator essentially shifts the center of the filter window closer to the current bar, resulting in more timely outputs while maintaining smoothing benefits.
Understanding Kernel Smoothing
At the heart of the Half Causal Estimator is kernel smoothing, a statistical technique that creates weighted averages where points closer to the center receive higher weights. This approach offers several advantages over simple moving averages. Unlike simple moving averages that weight all points equally, kernel smoothing applies a mathematically defined weight distribution. The weighting function helps minimize the impact of outliers and random fluctuations. Additionally, by adjusting the kernel width parameter, users can fine-tune the balance between responsiveness and smoothness.
The indicator supports three kernel types. The Gaussian kernel uses a bell-shaped distribution that weights central points heavily while still considering distant points. The Epanechnikov kernel employs a parabolic function that provides efficient noise reduction with a finite support range. The Triangular kernel applies a linear weighting that decreases uniformly from center to edges. These kernel functions provide the mathematical foundation for how the filter processes the combined window of past and "future" data points.
Applicable Data Sources
The indicator can be applied to three different data sources: volume (the trading volume of the security), true range (expressed as a percentage, measuring volatility), and change (the absolute percentage change from one closing price to the next).
Each of these variables shares the characteristic of being consistently positive and exhibiting cyclical intraday patterns, making them ideal candidates for this filtering approach.
Practical Applications
The Half Causal Estimator excels in scenarios where timely information is crucial. It helps in identifying volume climaxes or diminishing volume trends earlier than conventional indicators. It can detect changes in volatility patterns with reduced lag. The indicator is also useful for recognizing shifts in price momentum before they become obvious in price action, and providing smoother data for algorithmic trading systems that require reduced noise without sacrificing timeliness.
When volatility or volume spikes occur, conventional moving averages typically lag behind, potentially causing missed opportunities or delayed responses. The Half Causal Estimator produces signals that align more closely with actual market turns.
Technical Implementation
The implementation of the Half Causal Estimator involves several technical components working together. Data collection and organization is the first step—the indicator maintains a data structure that organizes market data by specific times of day. This creates a historical record of how volume, true range, or price change typically behaves at each minute/hour of the trading day.
For each calculation, the indicator constructs a composite window consisting of recent actual data points from the current session (the causal half) and historical averages for upcoming time periods from previous sessions (the non-causal half). The selected kernel function is then applied to this composite window, creating a weighted average where points closer to the center receive higher weights according to the mathematical properties of the chosen kernel. Finally, the kernel weights are normalized to ensure the output maintains proper scaling regardless of the kernel type or width parameter.
This framework enables the indicator to leverage the predictable time-of-day components in market data without trying to predict specific future values. Instead, it uses average historical patterns to reduce lag while maintaining the statistical benefits of smoothing techniques.
Configuration Options
The indicator provides several customization options. The data period setting determines the number of days of observations to store (0 uses all available data). Filter length controls the number of historical data points for the filter (total window size is length × 2 - 1). Filter width adjusts the width of the kernel function. Users can also select between Gaussian, Epanechnikov, and Triangular kernel functions, and customize visual settings such as colors and line width.
These parameters allow for fine-tuning the balance between responsiveness and smoothness based on individual trading preferences and the specific characteristics of the traded instrument.
Limitations
The indicator requires minute-based intraday timeframes, securities with volume data (when using volume as the source), and sufficient historical data to establish time-of-day patterns.
Conclusion
The Half Causal Estimator represents an innovative approach to technical analysis that addresses one of the fundamental limitations of traditional indicators: time lag. By incorporating time-of-day patterns into its calculations, it provides a more timely representation of market variables while maintaining the noise-reduction benefits of smoothing. This makes it a valuable tool for traders who need to make decisions based on real-time information about volume, volatility, or price changes.

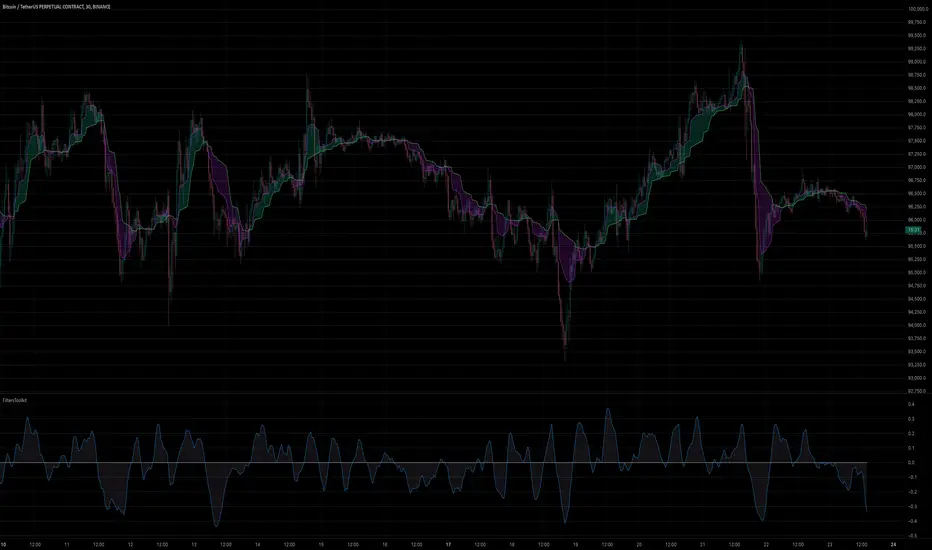
[GYTS] FiltersToolkit LibraryFiltersToolkit Library
🌸 Part of GoemonYae Trading System (GYTS) 🌸
🌸 --------- 1. INTRODUCTION --------- 🌸
💮 What Does This Library Contain?
This library is a curated collection of high-performance digital signal processing (DSP) filters and auxiliary functions designed specifically for financial time series analysis. It includes a shortlist of our favourite and best performing filters — each rigorously tested and selected for their responsiveness, minimal lag and robustness in diverse market conditions. These tools form an integral part of the GoemonYae Trading System (GYTS), chosen for their unique characteristics in handling market data.
The library contains two main categories:
1. Smoothing filters (low-pass filters and moving averages) for e.g. denoising, trend following
2. Detrending tools (high-pass and band-pass filters, known as "oscillators") for e.g. mean reversion
This collection is finely tuned for practical trading applications and is therefore not meant to be exhaustive. However, will continue to expand as we discover and validate new filtering techniques. I welcome collaboration and suggestions for novel approaches.
🌸 ——— 2. ADDED VALUE ——— 🌸
💮 Unified syntax and comprehensive documentation
The FiltersToolkit Library brings together a wide array of valuable filters under a unified, intuitive syntax. Each function is thoroughly documented, with clear explanations and academic sources that underline the mathematical rigour behind the methods. This level of documentation not only facilitates integration into trading strategies but also helps underlying the underlying concepts and rationale.
💮 Optimised performance and readability
The code prioritizes computational efficiency while maintaining readability. Key optimizations include:
- Minimizing redundant calculations in recursive filters
- Smart coefficient caching
- Efficient state management
- Vectorized operations where applicable
💮 Enhanced functionality and flexibility
Some filters in this library introduce extended functionality beyond the original publications. For instance, the MESA Adaptive Moving Average (MAMA) and Ehlers’ Combined Bandpass Filter incorporate multiple variations found in the literature, thereby providing traders with flexible tools that can be fine-tuned to different market conditions.
🌸 ——— 3. THE FILTERS ——— 🌸
💮 Hilbert Transform Function
This function implements the Hilbert Transform as utilised by John Ehlers. It converts a real-valued time series into its analytic signal, enabling the extraction of instantaneous phase and frequency information—an essential step in adaptive filtering.
Source: John Ehlers - "Rocket Science for Traders" (2001), "TASC 2001 V. 19:9", "Cybernetic Analysis for Stocks and Futures" (2004)
💮 Homodyne Discriminator
By leveraging the Hilbert Transform, this function computes the dominant cycle period through a Homodyne Discriminator. It extracts the in-phase and quadrature components of the signal, facilitating a robust estimation of the underlying cycle characteristics.
Source: John Ehlers - "Rocket Science for Traders" (2001), "TASC 2001 V. 19:9", "Cybernetic Analysis for Stocks and Futures" (2004)
💮 MESA Adaptive Moving Average (MAMA)
An advanced dual-stage adaptive moving average, this function outputs both the MAMA and its companion FAMA. It combines adaptive alpha computation with elements from Kaufman’s Adaptive Moving Average (KAMA) to provide a responsive and reliable trend indicator.
Source: John Ehlers - "Rocket Science for Traders" (2001), "TASC 2001 V. 19:9", "Cybernetic Analysis for Stocks and Futures" (2004)
💮 BiQuad Filters
A family of second-order recursive filters offering exceptional control over frequency response:
- High-pass filter for detrending
- Low-pass filter for smooth trend following
- Band-pass filter for cycle isolation
The quality factor (Q) parameter allows fine-tuning of the resonance characteristics, making these filters highly adaptable to different market conditions.
Source: Robert Bristow-Johnson's Audio EQ Cookbook, implemented by @The_Peaceful_Lizard
💮 Relative Vigor Index (RVI)
This filter evaluates the strength of a trend by comparing the closing price to the trading range. Operating similarly to a band-pass filter, the RVI provides insights into market momentum and potential reversals.
Source: John Ehlers – “Cybernetic Analysis for Stocks and Futures” (2004)
💮 Cyber Cycle
The Cyber Cycle filter emphasises market cycles by smoothing out noise and highlighting the dominant cyclical behaviour. It is particularly useful for detecting trend reversals and cyclical patterns in the price data.
Source: John Ehlers – “Cybernetic Analysis for Stocks and Futures” (2004)
💮 Butterworth High Pass Filter
Inspired by the classical Butterworth design, this filter achieves a maximally flat magnitude response in the passband while effectively removing low-frequency trends. Its design minimises phase distortion, which is vital for accurate signal interpretation.
Source: John Ehlers – “Cybernetic Analysis for Stocks and Futures” (2004)
💮 2-Pole SuperSmoother
Employing a two-pole design, the SuperSmoother filter reduces high-frequency noise with minimal lag. It is engineered to preserve trend integrity while offering a smooth output even in noisy market conditions.
Source: John Ehlers – “Cybernetic Analysis for Stocks and Futures” (2004)
💮 3-Pole SuperSmoother
An extension of the 2-pole design, the 3-pole SuperSmoother further attenuates high-frequency noise. Its additional pole delivers enhanced smoothing at the cost of slightly increased lag.
Source: John Ehlers – “Cybernetic Analysis for Stocks and Futures” (2004)
💮 Adaptive Directional Volatility Moving Average (ADXVma)
This adaptive moving average adjusts its smoothing factor based on directional volatility. By combining true range and directional movement measurements, it remains exceptionally flat during ranging markets and responsive during directional moves.
Source: Various implementations across platforms, unified and optimized
💮 Ehlers Combined Bandpass Filter with Automated Gain Control (AGC)
This sophisticated filter merges a highpass pre-processing stage with a bandpass filter. An integrated Automated Gain Control normalises the output to a consistent range, while offering both regular and truncated recursive formulations to manage lag.
Source: John F. Ehlers – “Truncated Indicators” (2020), “Cycle Analytics for Traders” (2013)
💮 Voss Predictive Filter
A forward-looking filter that predicts future values of a band-limited signal in real time. By utilising multiple time-delayed feedback terms, it provides anticipatory coupling and delivers a short-term predictive signal.
Source: John Ehlers - "A Peek Into The Future" (TASC 2019-08)
💮 Adaptive Autonomous Recursive Moving Average (A2RMA)
This filter dynamically adjusts its smoothing through an adaptive mechanism based on an efficiency ratio and a dynamic threshold. A double application of an adaptive moving average ensures both responsiveness and stability in volatile and ranging markets alike. Very flat response when properly tuned.
Source: @alexgrover (2019)
💮 Ultimate Smoother (2-Pole)
The Ultimate Smoother filter is engineered to achieve near-zero lag in its passband by subtracting a high-pass response from an all-pass response. This creates a filter that maintains signal fidelity at low frequencies while effectively filtering higher frequencies at the expense of slight overshooting.
Source: John Ehlers - TASC 2024-04 "The Ultimate Smoother"
Note: This library is actively maintained and enhanced. Suggestions for additional filters or improvements are welcome through the usual channels. The source code contains a list of tested filters that did not make it into the curated collection.
Ehlers Maclaurin Ultimate Smoother [CT]Ehlers Maclaurin Ultimate Smoother
Introduction
The Ehlers Maclaurin Ultimate Smoother is an innovative enhancement of the classic Ehlers SuperSmoother. By leveraging advanced Maclaurin series approximations, this indicator offers superior market analysis and signal generation.
The indicator combines Ehlers' Ultimate Smoother with Maclaurin series approximations to create a more efficient and accurate smoothing mechanism:
Input price data passes through the initial smoothing phase
Maclaurin series approximates trigonometric functions
Enhanced high-pass filter removes market noise
Final smoothing phase produces the output signal
Why the Maclaurin Approach?
The Maclaurin series is a special form of the Taylor series, centered around 0. It provides an efficient way to approximate complex functions using polynomial terms. In this indicator, we use the Maclaurin approach to improve the sine and cosine functions, resulting in:
Faster Calculations: By using polynomial approximations, we significantly reduce computational complexity.
Improved Stability: The approximation provides a more stable numerical basis for calculations.
Preservation of Precision: Despite the approximation, we maintain the precision needed for price smoothing.
Calculations
The indicator employs several key mathematical components:
Maclaurin Series Approximation:
sin(x) ≈ x - x³/3! + x⁵/5! - x⁷/7! + x⁹/9!
cos(x) ≈ 1 - x²/2! + x⁴/4! - x⁶/6! + x⁸/8!
Smoothing Algorithm:
Uses exponential smoothing with optimized coefficients
Implements high-pass filtering for noise reduction
Applies dynamic weighting based on market conditions
Mathematical Foundation
Utilizes Maclaurin series for trigonometric approximation
Implements Ehlers' smoothing principles
Incorporates advanced filtering techniques
Technical Advantages
Signal Processing:
Lag Reduction: Faster signal detection with less delay.
Noise Filtration: Effective elimination of high-frequency noise.
Precision Enhancement: Preservation of critical price movements.
Adaptive Processing: Dynamic response to market volatility.
Visual Enhancements:
Smart color intensity mapping.
Real-time visualization of trend strength.
Adaptive opacity based on movement significance.
Implementation
Core Configuration:
Plot Type: Choose between the original and the Maclaurin enhanced version.
Length: Default set to 30, optimal for daily timeframes.
hpLength: Default set to 10 for enhanced noise reduction.
Advanced Parameters:
The indicator offers advanced control with:
Dual processing modes (Original/Maclaurin).
Dynamic color intensity system.
Customizable smoothing parameters.
Professional Analysis Tools:
Accurate trend reversal identification.
Advanced support/resistance detection.
Superior performance in volatile markets.
Technical Specifications
Maclaurin Series Implementation:
The indicator employs a 5-term Maclaurin series approximation for both sine and cosine, ensuring efficient and accurate computation.
Performance Metrics
Improved processing efficiency.
Reduced memory utilization.
Increased signal accuracy.
Licensing & Attribution
© 2024 Mupsje aka CasaTropical
Professional Credits
Original Ultimate and SuperSmoother concept: John F. Ehlers
Maclaurin enhancement: Casa Tropical (CT)
www.mathsisfun.com

Catalyst TrendCatalyst Trend – A Comprehensive Trend and Regime Analyzer
The Catalyst Trend indicator was designed to dynamically and intuitively merge various classic analytical techniques. The goal is to filter out short-term market noise and reveal reliable trend phases or potential turning points. Below is a detailed explanation of its core elements and practical usage.
1. Concept and Idea
Multidimensional Trend Detection
This indicator goes beyond a simple momentum or volatility focus. It factors in multiple measurements to provide a more well-rounded market perspective.
Versatile Indicator Fusion
Linear Regression (LinReg): Multiple LinReg calculations are combined to smooth out price fluctuations and produce a robust trendline—known here as the “Cycle Reduced Line.”
ADX (Average Directional Index): Measures trend strength.
RSI (Relative Strength Index): Flags potential overbought or oversold conditions, in both the current timeframe and a higher timeframe.
ATR (Average True Range): Assesses volatility; used to dynamically adjust calculation lengths.
By weaving these elements together, the indicator adds value beyond simply stacking multiple indicators. It adapts to real-time market conditions, aiming to highlight genuine trends and reduce false signals.
2. Key Functions and Calculations
Dynamic Length & Smoothing
A blend of volatility (ATR), ADX values, and RSI inputs determines how many candles are used in the LinReg calculations and how heavily the data is smoothed.
This allows the indicator to respond promptly during periods of high volatility, while automatically adjusting to filter out unnecessary noise in quieter phases.c
Cycle Reduced Line
The script averages several offset LinReg calculations to produce a cleaner overall signal. Random outliers are thus minimized, making the trend path more visually consistent.
An additional EMA smoothing (“Final Smoothing”) further stabilizes this trendline, reducing the impact of minor price fluctuations.
Channel Bands (Optional)
These bands are derived from the standard deviation of the price residual (the difference between the smoothed price and the trendline).
They highlight potential over-extension zones: the upper band can mark short-term overbought areas, while the lower band might indicate oversold conditions.
Trend and Sideways Determination
Slope Calculation: The slope of the trendline (comparing the current bar to the previous one) helps identify short-term directional shifts.
DX Threshold: Once the ADX surpasses a user-defined threshold and the slope is positive, it may indicate a developing uptrend. Similarly, if the slope is negative and ADX > threshold, it could signal a potential downtrend.
Multi-Level Color Coding
Original Mode: Interpolated colors reflect uptrends, downtrends, and sideways phases, factoring in metrics like ADX and RSI.
Single Color: For a neutral look, the indicator can be displayed in one uniform color.
HTF RSI: This mode uses the higher-timeframe RSI to color the trendline (Long/Short/Neutral), offering a quick gauge of overarching market pressure.
3. Use Cases and Interpretation
Timeframes & Markets
The indicator is versatile and adapts well to different intervals, from 5-minute charts to weekly views.
It can be applied to various markets—crypto, forex, stocks—since volatility and trend strength are universal concepts.
Signal Recognition
Color Swings into a more pronounced upward hue (e.g., green) may signal mounting strength.
Neutral or mixed tones often point to sideways phases, which breakout traders might watch for potential price surges.
A shift to downward colors (e.g., red) may indicate a growing bearish trend.
Channel Bands & Volatility
When the bands spread widely, it’s wise to proceed with caution: abrupt spikes above the upper band or below the lower band can flag rapid short-term extremes.
These bands are more of a reference for potential overextension than a strict buy or sell trigger.
Additional Confirmations
Not a standalone panacea: The Catalyst Trend indicator is an analytical tool, best used alongside other methods such as volume analysis or price action (candlestick patterns, support/resistance levels) to bolster confidence in trading decisions.
4. Practical Tips
Parameter Adjustments
Depending on the market—crypto vs. traditional currency pairs—different ADX, RSI, or smoothing periods may be more effective. Experiment with the settings to tailor the indicator to your preferred timeframe.
Strategic Integration
Trailing Stops: For those riding a trend, the trendline or the channel bands may serve as a reference to trail stop-loss orders.
Trend Confirmation: Using RSI and ADX filters can help traders avoid sideways markets or stay the course when the trend is strong.
5. Important Final Notes
No Guarantee of Profits
No indicator can predict the future. Markets are inherently volatile and often unpredictable.
Responsible Risk Management
Test the indicator in a demo environment or with smaller positions before committing to large trades.

Hybrid Triple Exponential Smoothing🙏🏻 TV, I present you HTES aka Hybrid Triple Exponential Smoothing, designed by Holt & Winters in the US, assembled by me in Saint P. I apply exponential smoothing individually to the data itself, then to residuals from the fitted values, and lastly to one-point forecast (OPF) errors, hence 'hybrid'. At the same time, the method is a closed-form solution and purely online, no need to make any recalculations & optimize anything, so the method is O(1).
^^ historical OPFs and one-point forecasting interval plotted instead of fitted values and prediction interval
Before the How-to, first let me tell you some non-obvious things about Triple Exponential smoothing (and about Exponential Smoothing in general) that not many catch. Expo smoothing seems very straightforward and obvious, but if you look deeper...
1) The whole point of exponential smoothing is its incremental/online nature, and its O(1) algorithm complexity, making it dope for high-frequency streaming data that is also univariate and has no weights. Consequently:
- Any hybrid models that involve expo smoothing and any type of ML models like gradient boosting applied to residuals rarely make much sense business-wise: if you have resources to boost the residuals, you prolly have resources to use something instead of expo smoothing;
- It also concerns the fashion of using optimizers to pick smoothing parameters; honestly, if you use this approach, you have to retrain on each datapoint, which is crazy in a streaming context. If you're not in a streaming context, why expo smoothing? What makes more sense is either picking smoothing parameters once, guided by exogenous info, or using dynamic ones calculated in a minimalistic and elegant way (more on that in further drops).
2) No matter how 'right' you choose the smoothing parameters, all the resulting components (level, trend, seasonal) are not pure; each of them contains a bit of info from the other components, this is just how non-sequential expo smoothing works. You gotta know this if you wanna use expo smoothing to decompose your time series into separate components. The only pure component there, lol, is the residuals;
3) Given what I've just said, treating the level (that does contain trend and seasonal components partially) as the resulting fit is a mistake. The resulting fit is level (l) + trend (b) + seasonal (s). And from this fit, you calculate residuals;
4) The residuals component is not some kind of bad thing; it is simply the component that contains info you consciously decide not to include in your model for whatever reason;
5) Forecasting Errors and Residuals from fitted values are 2 different things. The former are deltas between the forecasts you've made and actual values you've observed, the latter are simply differences between actual datapoints and in-sample fitted values;
6) Residuals are used for in-sample prediction intervals, errors for out-of-sample forecasting intervals;
7) Choosing between single, double, or triple expo smoothing should not be based exclusively on the nature of your data, but on what you need to do as well. For example:
- If you have trending seasonal data and you wanna do forecasting exclusively within the expo smoothing framework, then yes, you need Triple Exponential Smoothing;
- If you wanna use prediction intervals for generating trend-trading signals and you disregard seasonality, then you need single (simple) expo smoothing, even on trending data. Otherwise, the trend component will be included in your model's fitted values → prediction intervals.
8) Kind of not non-obvious, but when you put one smoothing parameter to zero, you basically disregard this component. E.g., in triple expo smoothing, when you put gamma and beta to zero, you basically end up with single exponential smoothing.
^^ data smoothing, beta and gamma zeroed out, forecasting steps = 0
About the implementation
* I use a simple power transform that results in a log transform with lambda = 0 instead of the mainstream-used transformers (if you put lambda on 2 in Box-Cox, you won't get a power of 2 transform)
* Separate set of smoothing parameters for data, residuals, and errors smoothing
* Separate band multipliers for residuals and errors
* Both typical error and typical residuals get multiplied by math.sqrt(math.pi / 2) in order to approach standard deviation so you can ~use Z values and get more or less corresponding probabilities
* In script settings → style, you can switch on/off plotting of many things that get calculated internally:
- You can visualize separate components (just remember they are not pure);
- You can switch off fit and switch on OPF plotting;
- You can plot residuals and their exponentially smoothed typical value to pick the smoothing parameters for both data and residuals;
- Or you might plot errors and play with data smoothing parameters to minimize them (consult SAE aka Sum of Absolute Errors plot);
^^ nuff said
More ideas on how to use the thing
1) Use Double Exponential Smoothing (data gamma = 0) to detrend your time series for further processing (Fourier likes at least weakly stationary data);
2) Put single expo smoothing on your strategy/subaccount equity chart (data alpha = data beta = 0), set prediction interval deviation multiplier to 1, run your strat live on simulator, start executing on real market when equity on simulator hits upper deviation (prediction interval), stop trading if equity hits lower deviation on simulator. Basically, let the strat always run on simulator, but send real orders to a real market when the strat is successful on your simulator;
3) Set up the model to minimize one-point forecasting errors, put error forecasting steps to 1, now you're doing nowcasting;
4) Forecast noisy trending sine waves for fun.
^^ nuff said 2
All Good TV ∞

Normalized Linear Regression (LSMA) OscillatorNormalized Linear Regression (LSMA) Oscillator
By Nathan Farmer
The Normalized LSMA Oscillator is a trend-following indicator that enhances the classic Linear Regression (LSMA) by applying a range of normalization techniques. This indicator allows traders to smooth out and normalize LSMA signals for better trend detection and dynamic market adaptation.
Key Features:
Configurable Normalization Methods:
This indicator offers several normalization techniques, such as Z-Score, Min-Max, Mean Normalization, Robust Scaler, Logistic Function, and Quantile Transformation. Each method helps in refining LSMA outputs to improve clarity in both trending and ranging market conditions.
Smoothing Options:
Smoothing can be applied after normalization, helping to reduce noise in the signals, thus making trend-following strategies that use this indicator more effective.
Recommended Settings:
Logistic Function Normalization: Recommended length of around 12, based on my preferred signal frequency.
Z-Score Normalization: Medium period (close to the default of 50), based on my preferred signal frequency.
Min-Max Normalization: Medium period, based on my preferred signal frequency.
Mean Normalization: Medium period, based on my preferred signal frequency.
Robust Scaler: Medium period, based on my preferred signal frequency.
Quantile Transformation: Medium period, based on my preferred signal frequency.
Usage:
Designed primarily for trend-following strategies, this indicator adapts well to varying market conditions. Traders can experiment with the various normalization and smoothing settings to match the indicator to their specific needs and market preferences.
Recommendation before usage:
Always backtest the indicator for yourself with respect to how you intend to use it. Modify the parameters to suit your needs, over your preferred time frame, on your preferred asset. My preferences are for the assets I happened to be looking at when I made this indicator. Odds are, you're looking at something else, over a different time frame, in a different market environment than what my settings are tailored for.

Kalman PSaR [BackQuant]Kalman PSaR
Overview and Innovation
The Kalman PSaR combines the well-known Parabolic SAR (PSaR) with the advanced smoothing capabilities of the Kalman Filter . This innovative tool aims to enhance the traditional PSaR by integrating Kalman filtering, which reduces noise and improves trend detection. The Kalman PSaR adapts dynamically to price movements, making it a highly effective indicator for spotting trend shifts while minimizing the impact of false signals caused by market volatility.
Please Find the Basic Kalman Here:
Kalman Filter Dynamics
The Kalman Filter is a powerful algorithm for estimating the true value of a system amidst noisy data. In the Kalman PSaR, this filter is applied to the high, low, and closing prices, resulting in a smoother and more accurate representation of price action. The filter’s parameters—process noise and measurement noise—are customizable, allowing traders to fine-tune the sensitivity of the indicator to market conditions. By reducing the impact of noise, the Kalman-filtered PSaR offers clearer signals for identifying trend reversals and continuations.
Enhanced PSaR Calculation
The traditional Parabolic SAR is a popular trend-following indicator that highlights potential entry and exit points based on price acceleration. In the Kalman PSaR, this calculation is enhanced by the Kalman-filtered prices, providing a smoother and more reliable signal. The indicator continuously updates based on the acceleration factor and max step values, while the Kalman filter ensures that sudden price spikes or market noise do not trigger false signals.
Min Step and Max Step: These settings control the sensitivity of the PSaR. The Min Step sets the initial acceleration factor, while the Max Step limits how fast the PSaR adapts to price changes, helping traders fine-tune the indicator’s responsiveness.
Optional Smoothing Techniques To further enhance the signal clarity, the Kalman PSaR includes an optional smoothing feature. Traders can choose from various smoothing methods, such as SMA, Hull, EMA, WMA, TEMA, and more, to reduce short-term fluctuations and emphasize the underlying trend. The smoothing period is customizable, allowing traders to adjust the indicator’s behavior according to their preferred trading style and timeframe.
Color-Coded Candle Painting The Kalman PSaR features color-coded candles that change according to the trend direction. When the price is above the PSaR, candles are painted green to indicate a long trend, and when the price is below the PSaR, candles are painted red to signal a short trend. This visual representation makes it easy to interpret market sentiment at a glance, improving decision-making speed during fast-moving markets.
Key Features and Customization
Kalman Filter Customization: The process noise and measurement noise parameters allow traders to adjust how aggressively the filter adapts to price changes, making it suitable for both volatile and stable markets.
Smoothing Options: A variety of moving average types, such as SMA, Hull, EMA, and more, can be applied to smooth the PSaR values, ensuring that the signal remains clear even in choppy markets.
Dynamic Trend Detection: The Kalman PSaR dynamically updates based on price movements, helping traders spot trend reversals early while filtering out false signals caused by short-term volatility.
Bar Coloring and PSaR Plotting: Traders can choose to color candles based on trend direction or plot the PSaR directly on the chart for additional visual clarity.
Practical Applications
Trend-Following Strategies: The Kalman PSaR excels in trend-following strategies by providing timely signals of trend changes. The dynamic nature of the indicator allows traders to capture significant price movements while avoiding market noise.
Reversal Identification: The indicator’s ability to filter out noise and provide smoother signals makes it ideal for identifying reversals in volatile markets.
Risk Management: By plotting clear stop levels based on the PSaR, traders can use this indicator to effectively manage risk, placing stop-loss orders at key points based on the trend direction.
Conclusion
The Kalman PSaR is a fusion of the classic Parabolic SAR and the Kalman filter, offering enhanced trend detection with reduced noise. Its customizable filtering and smoothing options, combined with dynamic trend-following capabilities, make it a versatile tool for traders seeking to improve their timing and signal accuracy. The adaptive nature of the Kalman filter, combined with the robust PSaR logic, helps traders stay on the right side of the market and manage risk more effectively.

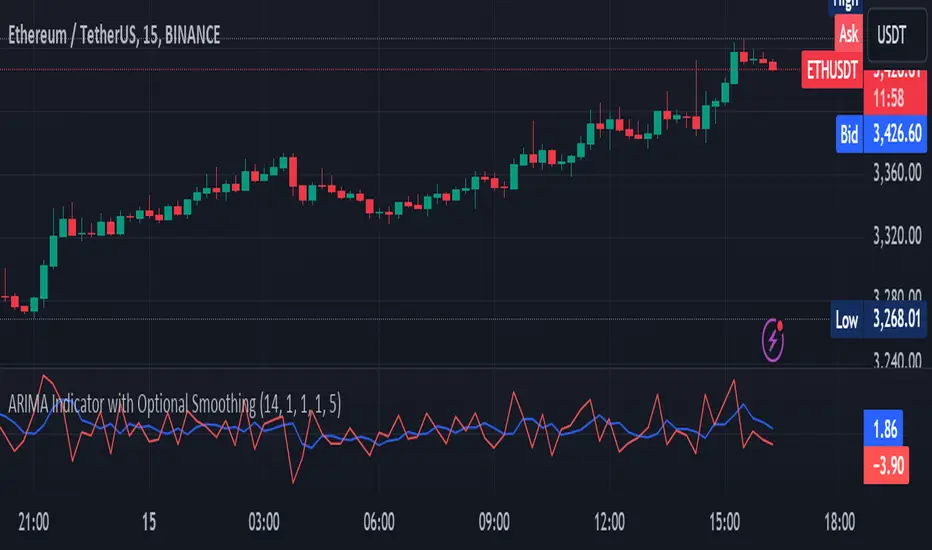
ARIMA Indicator with Optional SmoothingOverview
The ARIMA (AutoRegressive Integrated Moving Average) Indicator is a powerful tool used to forecast future price movements by combining differencing, autoregressive, and moving average components. This indicator is designed to help traders identify trends and potential reversal points by analyzing the historical price data.
Key Features
AutoRegressive Component (AR): Utilizes past values to predict future prices.
Moving Average Component (MA): Averages past price differences to smooth out noise.
Differencing: Reduces non-stationarity in the time series data.
Optional Smoothing: Applies EMA to the ARIMA output for a smoother signal.
Customizable Parameters: Allows users to adjust AR and MA orders, differencing periods, and smoothing lengths.
Concepts Underlying the Calculations
Differencing: Subtracts previous prices from current prices to remove trends and seasonality, making the data stationary.
AutoRegressive Component (AR): Predicts future prices based on a linear combination of past values.
Moving Average Component (MA): Uses past forecast errors to refine future predictions.
Exponential Moving Average (EMA): Applies more weight to recent prices, providing a smoother and more responsive signal.
How It Works
The ARIMA Indicator first calculates the differenced series to achieve stationarity. Then, it computes the simple moving average (SMA) of this differenced series. The indicator uses the AR and MA components to adjust the SMA, creating an approximation of the ARIMA model. Finally, an optional smoothing step using EMA can be applied to the ARIMA approximation to produce a smoother signal.
How Traders Can Use It
Traders can use the ARIMA Indicator to:
Identify Trends: Detect emerging trends by observing the direction of the ARIMA line.
Spot Reversals: Look for divergences between the ARIMA line and the price to identify potential reversal points.
Generate Trading Signals: Use crossovers between the ARIMA line and the price to generate buy or sell signals.
Filter Noise: Enable the optional smoothing to filter out market noise and focus on significant price movements.
Example Usage Instructions
Add the ARIMA Indicator to your chart.
Adjust the input parameters to suit your trading strategy:
Set the SMA Length (e.g., 14).
Choose the Differencing Period (e.g., 1).
Define the AR Order (p) and MA Order (q) (e.g., 1).
Configure the Smoothing Length if smoothing is desired (e.g., 5).
Enable or disable smoothing as needed.
Observe the ARIMA line (blue) and compare it to the price chart.
Use the ARIMA line to identify trends and potential reversals.
Implement trading decisions based on the ARIMA line’s behavior relative to the price.
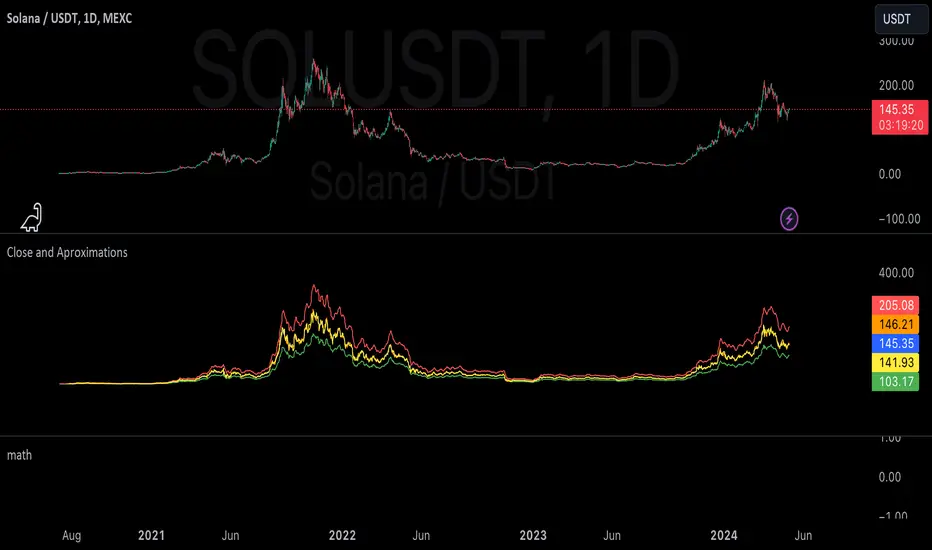
mathLibrary "math"
It's a library of discrete aproximations of a price or Series float it uses Fourier Discrete transform, Laplace Discrete Original and Modified transform and Euler's Theoreum for Homogenus White noice operations. Calling functions without source value it automatically take close as the default source value.
Here is a picture of Laplace and Fourier approximated close prices from this library:
Copy this indicator and try it yourself:
import AutomatedTradingAlgorithms/math/1 as math
//@version=5
indicator("Close Price with Aproximations", shorttitle="Close and Aproximations", overlay=false)
// Sample input data (replace this with your own data)
inputData = close
// Plot Close Price
plot(inputData, color=color.blue, title="Close Price")
ltf32_result = math.LTF32(a=0.01)
plot(ltf32_result, color=color.green, title="LTF32 Aproximation")
fft_result = math.FFT()
plot(fft_result, color=color.red, title="Fourier Aproximation")
wavelet_result = math.Wavelet()
plot(wavelet_result, color=color.orange, title="Wavelet Aproximation")
wavelet_std_result = math.Wavelet_std()
plot(wavelet_std_result, color=color.yellow, title="Wavelet_std Aproximation")
DFT3(xval, _dir)
Discrete Fourier Transform with last 3 points
Parameters:
xval (float) : Source series
_dir (int) : Direction parameter
Returns: Aproxiated source value
DFT2(xval, _dir)
Discrete Fourier Transform with last 2 points
Parameters:
xval (float) : Source series
_dir (int) : Direction parameter
Returns: Aproxiated source value
FFT(xval)
Fast Fourier Transform once. It aproximates usig last 3 points.
Parameters:
xval (float) : Source series
Returns: Aproxiated source value
DFT32(xval)
Combined Discrete Fourier Transforms of DFT3 and DTF2 it aproximates last point by first
aproximating last 3 ponts and than using last 2 points of the previus.
Parameters:
xval (float) : Source series
Returns: Aproxiated source value
DTF32(xval)
Combined Discrete Fourier Transforms of DFT3 and DTF2 it aproximates last point by first
aproximating last 3 ponts and than using last 2 points of the previus.
Parameters:
xval (float) : Source series
Returns: Aproxiated source value
LFT3(xval, _dir, a)
Discrete Laplace Transform with last 3 points
Parameters:
xval (float) : Source series
_dir (int) : Direction parameter
a (float) : laplace coeficient
Returns: Aproxiated source value
LFT2(xval, _dir, a)
Discrete Laplace Transform with last 2 points
Parameters:
xval (float) : Source series
_dir (int) : Direction parameter
a (float) : laplace coeficient
Returns: Aproxiated source value
LFT(xval, a)
Fast Laplace Transform once. It aproximates usig last 3 points.
Parameters:
xval (float) : Source series
a (float) : laplace coeficient
Returns: Aproxiated source value
LFT32(xval, a)
Combined Discrete Laplace Transforms of LFT3 and LTF2 it aproximates last point by first
aproximating last 3 ponts and than using last 2 points of the previus.
Parameters:
xval (float) : Source series
a (float) : laplace coeficient
Returns: Aproxiated source value
LTF32(xval, a)
Combined Discrete Laplace Transforms of LFT3 and LTF2 it aproximates last point by first
aproximating last 3 ponts and than using last 2 points of the previus.
Parameters:
xval (float) : Source series
a (float) : laplace coeficient
Returns: Aproxiated source value
whitenoise(indic_, _devided, minEmaLength, maxEmaLength, src)
Ehler's Universal Oscillator with White Noise, without extra aproximated src.
It uses dinamic EMA to aproximate indicator and thus reducing noise.
Parameters:
indic_ (float) : Input series for the indicator values to be smoothed
_devided (int) : Divisor for oscillator calculations
minEmaLength (int) : Minimum EMA length
maxEmaLength (int) : Maximum EMA length
src (float) : Source series
Returns: Smoothed indicator value
whitenoise(indic_, dft1, _devided, minEmaLength, maxEmaLength, src)
Ehler's Universal Oscillator with White Noise and DFT1.
It uses src and sproxiated src (dft1) to clearly define white noice.
It uses dinamic EMA to aproximate indicator and thus reducing noise.
Parameters:
indic_ (float) : Input series for the indicator values to be smoothed
dft1 (float) : Aproximated src value for white noice calculation
_devided (int) : Divisor for oscillator calculations
minEmaLength (int) : Minimum EMA length
maxEmaLength (int) : Maximum EMA length
src (float) : Source series
Returns: Smoothed indicator value
smooth(dft1, indic__, _devided, minEmaLength, maxEmaLength, src)
Smoothing source value with help of indicator series and aproximated source value
It uses src and sproxiated src (dft1) to clearly define white noice.
It uses dinamic EMA to aproximate src and thus reducing noise.
Parameters:
dft1 (float) : Value to be smoothed.
indic__ (float) : Optional input for indicator to help smooth dft1 (default is FFT)
_devided (int) : Divisor for smoothing calculations
minEmaLength (int) : Minimum EMA length
maxEmaLength (int) : Maximum EMA length
src (float) : Source series
Returns: Smoothed source (src) series
smooth(indic__, _devided, minEmaLength, maxEmaLength, src)
Smoothing source value with help of indicator series
It uses dinamic EMA to aproximate src and thus reducing noise.
Parameters:
indic__ (float) : Optional input for indicator to help smooth dft1 (default is FFT)
_devided (int) : Divisor for smoothing calculations
minEmaLength (int) : Minimum EMA length
maxEmaLength (int) : Maximum EMA length
src (float) : Source series
Returns: Smoothed src series
vzo_ema(src, len)
Volume Zone Oscillator with EMA smoothing
Parameters:
src (float) : Source series
len (simple int) : Length parameter for EMA
Returns: VZO value
vzo_sma(src, len)
Volume Zone Oscillator with SMA smoothing
Parameters:
src (float) : Source series
len (int) : Length parameter for SMA
Returns: VZO value
vzo_wma(src, len)
Volume Zone Oscillator with WMA smoothing
Parameters:
src (float) : Source series
len (int) : Length parameter for WMA
Returns: VZO value
alma2(series, windowsize, offset, sigma)
Arnaud Legoux Moving Average 2 accepts sigma as series float
Parameters:
series (float) : Input series
windowsize (int) : Size of the moving average window
offset (float) : Offset parameter
sigma (float) : Sigma parameter
Returns: ALMA value
Wavelet(src, len, offset, sigma)
Aproxiates srt using Discrete wavelet transform.
Parameters:
src (float) : Source series
len (int) : Length parameter for ALMA
offset (simple float)
sigma (simple float)
Returns: Wavelet-transformed series
Wavelet_std(src, len, offset, mag)
Aproxiates srt using Discrete wavelet transform with standard deviation as a magnitude.
Parameters:
src (float) : Source series
len (int) : Length parameter for ALMA
offset (float) : Offset parameter for ALMA
mag (int) : Magnitude parameter for standard deviation
Returns: Wavelet-transformed series
LaplaceTransform(xval, N, a)
Original Laplace Transform over N set of close prices
Parameters:
xval (float) : series to aproximate
N (int) : number of close prices in calculations
a (float) : laplace coeficient
Returns: Aproxiated source value
NLaplaceTransform(xval, N, a, repeat)
Y repetirions on Original Laplace Transform over N set of close prices, each time N-k set of close prices
Parameters:
xval (float) : series to aproximate
N (int) : number of close prices in calculations
a (float) : laplace coeficient
repeat (int) : number of repetitions
Returns: Aproxiated source value
LaplaceTransformsum(xval, N, a, b)
Sum of 2 exponent coeficient of Laplace Transform over N set of close prices
Parameters:
xval (float) : series to aproximate
N (int) : number of close prices in calculations
a (float) : laplace coeficient
b (float) : second laplace coeficient
Returns: Aproxiated source value
NLaplaceTransformdiff(xval, N, a, b, repeat)
Difference of 2 exponent coeficient of Laplace Transform over N set of close prices
Parameters:
xval (float) : series to aproximate
N (int) : number of close prices in calculations
a (float) : laplace coeficient
b (float) : second laplace coeficient
repeat (int) : number of repetitions
Returns: Aproxiated source value
N_divLaplaceTransformdiff(xval, N, a, b, repeat)
N repetitions of Difference of 2 exponent coeficient of Laplace Transform over N set of close prices, with dynamic rotation
Parameters:
xval (float) : series to aproximate
N (int) : number of close prices in calculations
a (float) : laplace coeficient
b (float) : second laplace coeficient
repeat (int) : number of repetitions
Returns: Aproxiated source value
LaplaceTransformdiff(xval, N, a, b)
Difference of 2 exponent coeficient of Laplace Transform over N set of close prices
Parameters:
xval (float) : series to aproximate
N (int) : number of close prices in calculations
a (float) : laplace coeficient
b (float) : second laplace coeficient
Returns: Aproxiated source value
NLaplaceTransformdiffFrom2(xval, N, a, b, repeat)
N repetitions of Difference of 2 exponent coeficient of Laplace Transform over N set of close prices, second element has for 1 higher exponent factor
Parameters:
xval (float) : series to aproximate
N (int) : number of close prices in calculations
a (float) : laplace coeficient
b (float) : second laplace coeficient
repeat (int) : number of repetitions
Returns: Aproxiated source value
N_divLaplaceTransformdiffFrom2(xval, N, a, b, repeat)
N repetitions of Difference of 2 exponent coeficient of Laplace Transform over N set of close prices, second element has for 1 higher exponent factor, dynamic rotation
Parameters:
xval (float) : series to aproximate
N (int) : number of close prices in calculations
a (float) : laplace coeficient
b (float) : second laplace coeficient
repeat (int) : number of repetitions
Returns: Aproxiated source value
LaplaceTransformdiffFrom2(xval, N, a, b)
Difference of 2 exponent coeficient of Laplace Transform over N set of close prices, second element has for 1 higher exponent factor
Parameters:
xval (float) : series to aproximate
N (int) : number of close prices in calculations
a (float) : laplace coeficient
b (float) : second laplace coeficient
Returns: Aproxiated source value
Fine-tune Inputs: Fourier Smoothed Volume zone oscillator WFSVZ0Use this Strategy to Fine-tune inputs for the (W&)FSVZ0 Indicator.
Strategy allows you to fine-tune the indicator for 1 TimeFrame at a time; cross Timeframe Input fine-tuning is done manually after exporting the chart data.
I suggest using "Close all" input False when fine-tuning Inputs for 1 TimeFrame. When you export data to Excel/Numbers/GSheets I suggest using "Close all" input as True, except for the lowest TimeFrame.
MEANINGFUL DESCRIPTION:
The Volume Zone oscillator breaks up volume activity into positive and negative categories. It is positive when the current closing price is greater than the prior closing price and negative when it's lower than the prior closing price. The resulting curve plots through relative percentage levels that yield a series of buy and sell signals, depending on level and indicator direction.
The Wavelet & Fourier Smoothed Volume Zone Oscillator (W&)FSVZO is a refined version of the Volume Zone Oscillator, enhanced by the implementation of the Discrete Fourier Transform . Its primary function is to streamline price data and diminish market noise, thus offering a clearer and more precise reflection of price trends.
By combining the Wavalet and Fourier aproximation with Ehler's white noise histogram, users gain a comprehensive perspective on volume-related market conditions.
HOW TO USE THE INDICATOR:
The default period is 2 but can be adjusted after backtesting. (I suggest 5 VZO length and NoiceR max length 8 as-well)
The VZO points to a positive trend when it is rising above the 0% level, and a negative trend when it is falling below the 0% level. 0% level can be adjusted in setting by adjusting VzoDifference. Oscillations rising below 0% level or falling above 0% level result in a natural trend.
HOW TO USE THE STRATEGY:
Here you fine-tune the inputs until you find a combination that works well on all Timeframes you will use when creating your Automated Trade Algorithmic Strategy. I suggest 4h, 12h, 1D, 2D, 3D, 4D, 5D, 6D, W and M.
When I ndicator/Strategy returns 0 or natural trend , Strategy Closes All it's positions.
ORIGINALITY & USFULLNESS:
Personal combination of Fourier and Wavalet aproximation of a price which results in less noise Volume Zone Oscillator.
The Wavelet Transform is a powerful mathematical tool for signal analysis, particularly effective in analyzing signals with varying frequency or non-stationary characteristics. It dissects a signal into wavelets, small waves with varying frequency and limited duration, providing a multi-resolution analysis. This approach captures both frequency and location information, making it especially useful for detecting changes or anomalies in complex signals.
The Discrete Fourier Transform (DFT) is a mathematical technique that transforms discrete data from the time domain into its corresponding representation in the frequency domain. This process involves breaking down a signal into its individual frequency components, thereby exposing the amplitude and phase characteristics inherent in each frequency element.
This indicator utilizes the concept of Ehler's Universal Oscillator and displays a histogram, offering critical insights into the prevailing levels of market noise. The Ehler's Universal Oscillator is grounded in a statistical model that captures the erratic and unpredictable nature of market movements. Through the application of this principle, the histogram aids traders in pinpointing times when market volatility is either rising or subsiding.
DETAILED DESCRIPTION:
My detailed description of the indicator and use cases which I find very valuable.
What is oscillator?
Oscillators are chart indicators that can assist a trader in determining overbought or oversold conditions in ranging (non-trending) markets.
What is volume zone oscillator?
Price Zone Oscillator measures if the most recent closing price is above or below the preceding closing price.
Volume Zone Oscillator is Volume multiplied by the 1 or -1 depending on the difference of the preceding 2 close prices and smoothed with Exponential moving Average.
What does this mean?
If the VZO is above 0 and VZO is rising. We have a bullish trend. Most likely.
If the VZO is below 0 and VZO is falling. We have a bearish trend. Most likely.
Rising means that VZO on close is higher than the previous day.
Falling means that VZO on close is lower than the previous day.
What if VZO is falling above 0 line?
It means we have a high probability of a bearish trend.
Thus the indicator returns 0 and Strategy closes all it's positions when falling above 0 (or rising bellow 0) and we combine higher and lower timeframes to gauge the trend.
In the next Image you can see that trend is negative on 4h, negative on 12h and positive on 1D. That means trend is negative.
I am sorry, the chart is a bit messy. The idea is to use the indicator over more than 1 Timeframe.
What is approximation and smoothing?
They are mathematical concepts for making a discrete set of numbers a
continuous curved line.
Fourier and Wavelet approximation of a close price are taken from aprox library.
Key Features:
You can tailor the Indicator/Strategy to your preferences with adjustable parameters such as VZO length, noise reduction settings, and smoothing length.
Volume Zone Oscillator (VZO) shows market sentiment with the VZO, enhanced with Exponential Moving Average (EMA) smoothing for clearer trend identification.
Noise Reduction leverages Euler's White noise capabilities for effective noise reduction in the VZO, providing a cleaner and more accurate representation of market dynamics.
Choose between the traditional Fast Fourier Transform (FFT) , the innovative Double Discrete Fourier Transform (DTF32) and Wavelet soothed Fourier soothed price series to suit your analytical needs.
Image of Wavelet transform with FAST settings, Double Fourier transform with FAST settings. Improved noice reduction with SLOW settings, and standard FSVZO with SLOW settings:
Fast setting are setting by default:
VZO length = 2
NoiceR max Length = 2
Slow settings are:
VZO length = 5 or 7
NoiceR max Length = 8
As you can see fast setting are more volatile. I suggest averaging fast setting on 4h 12h 1d 2d 3d 4d W and M Timeframe to get a clear view on market trend.
What if I want long only when VZO is rising and above 15 not 0?
You have set Setting VzoDifference to 15. That reduces the number of trend changes.
Example of W&FSVZO with VzoDifference 15 than 0:
VZO crossed 0 line but not 15 line and that's why Indicator returns 0 in one case an 1 in another.
What is Smooth length setting?
A way of calculating Bullish or Bearish (W&)FSVZO .
If smooth length is 2 the trend is rising if:
rising = VZO > ta.ema(VZO, 2)
Meaning that we check if VZO is higher that exponential average of the last 2 elements.
If smooth length is 1 the trend is rising if:
rising = VZO_ > VZO_
Use this Strategy to fine-tune inputs for the (W&)FSVZO Indicator.
(Strategy allows you to fine-tune the indicator for 1 TimeFrame at a time; cross Timeframe Input fine-tuning is done manually after exporting the chart data)
I suggest using " Close all " input False when fine-tuning Inputs for 1 TimeFrame . When you export data to Excel/Numbers/GSheets I suggest using " Close all " input as True , except for the lowest TimeFrame . I suggest using 100% equity as your default quantity for fine-tune purposes. I have to mention that 100% equity may lead to unrealistic backtesting results. Be avare. When backtesting for trading purposes use Contracts or USDT.

TASC 2024.04 The Ultimate Smoother█ OVERVIEW
This script presents an implementation of the digital smoothing filter introduced by John Ehlers in his article "The Ultimate Smoother" from the April 2024 edition of TASC's Traders' Tips .
█ CONCEPTS
The UltimateSmoother preserves low-frequency swings in the input time series while attenuating high-frequency variations and noise. The defining input parameter of the UltimateSmoother is the critical period , which represents the minimum wavelength (highest frequency) in the filter's pass band. In other words, the filter attenuates or removes the amplitudes of oscillations at shorter periods than the critical period.
According to Ehlers, one primary advantage of the UltimateSmoother is that it maintains zero lag in its pass band and minimal lag in its transition band, distinguishing it from other conventional digital filters (e.g., moving averages ). One can apply this smoother to various input data series, including other indicators.
█ CALCULATIONS
Ehlers derived the UltimateSmoother using inspiration from the design principles he learned from his experience with analog filters , as described in the original publication. On a technical level, the UltimateSmoother's unique response involves subtracting a high-pass response from an all-pass response . At very low frequencies (lengthy periods), where the high-pass filter response has virtually no amplitude, the subtraction yields a frequency and phase response practically equivalent to the input data. At other frequencies, the subtraction achieves filtration through cancellation due to the close similarities in response between the high-pass filter and the input data.
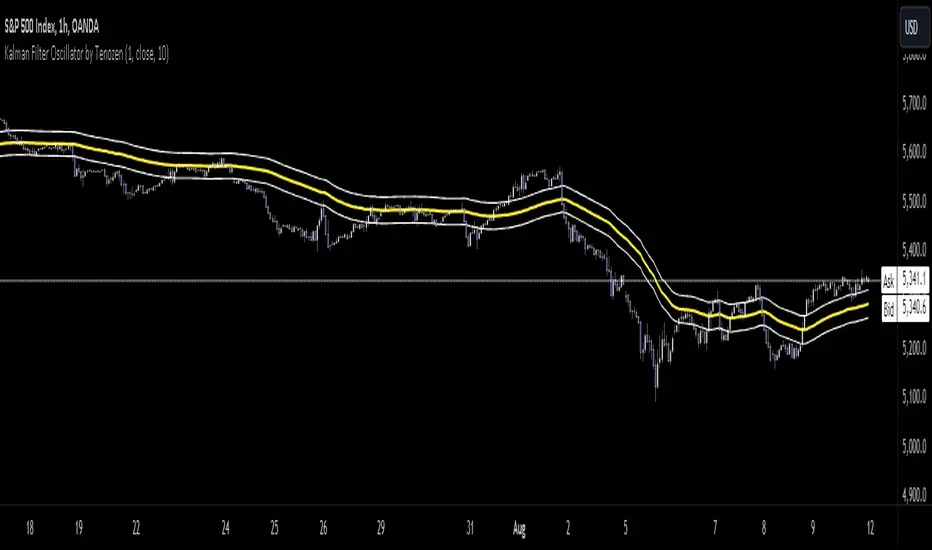
Kalman Filter by TenozenAnother useful indicator is here! Kalman Filter is a quantitative tool created by Rudolf E. Kalman. In the case of trading, it can help smooth out the price data that traders observe, making it easier to identify underlying trends. The Kalman Filter is particularly useful for handling price data that is noisy and unpredictable. As an adaptive-based algorithm, it can easily adjust to new data, which makes it a handy tool for traders operating in markets that are prone to change quickly.
Many people may assume that the Kalman Filter is the same as a Moving Average, but that is not the case. While both tools aim to smooth data and find trends, they serve different purposes and have their own sets of advantages and disadvantages. The Kalman Filter provides a more dynamic and adaptive approach, making it suitable for real-time analysis and predictive capabilities, but it is also more complex. On the other hand, Moving Averages offer a simpler and more intuitive way to visualize trends, which makes them a popular choice among traders for technical analysis. However, the Moving Average is a lagging indicator and less adaptive to market change, if it's adjusted it may result in overfitting. In this case, the Kalman Filter would be a better choice for smoothing the price up.
I hope you find this indicator useful! It's been an exciting and extensive journey since I began diving into the world of finance and trading. I'll keep you all updated on any new indicators I discover that could benefit the community in the future. Until then, take care, and happy trading! Ciao.
Nasan Rate of Change (ROC)**NOTE: FOR COMPARISON TRADITIONAL ROC IS PLOTTED WITH THE SAME ROC LENGTH OF 9. IT IS NOT PART OF THE INDICATOR"
The Nasan ROC indicator is smoothed version of the of the traditional ROC indicator. The Nasna ROC uses a triple pass moving average differencing strategy. A cumulative sum of the deviations obtained from the moving average differencing provides a smooth "noise free" trend and this cumulative sum of deviations is used for calculating ROC.
Let's break down the components and understand the indicator we discussed earlier:
Sequential Triple Pass Filter:
Three filters with lengths specified by length1, length2, and length3 are applied to the closing prices (close).
The filters involve calculating the cumulative sum of the differences between the closing prices and their respective moving averages.
The idea is to detrend the data and accumulate the deviations from the average over time, emphasizing longer-term trends.
Calculation of Rate of Change (ROC) of Cumulative Sum:
The Rate of Change (ROC) of the cumulative sum (rocCumulativeSum) is calculated using the ta.roc function with a specified length (rocLength).
ROC measures the percentage change in the cumulative sum over a specified period.
The ROC histogram provides insights into the momentum of the detrended series. Positive values suggest increasing momentum, while negative values suggest decreasing momentum.
Pay attention to the color of the histogram bars.
The histogram bars are colored green if the current ROC value is greater than or equal to the previous ROC value, and red otherwise.
This coloring is based on the concept that a positive ROC suggests upward momentum, while a negative ROC suggests downward momentum.
Volatility - Volume Impact:
The Average True Range (ATR) is calculated with a period of 14.
Volume strength is calculated as a factor (VCF) that considers the ratio of the simple moving average (SMA) of the current volume to the SMA of the volume over a longer period (144).
This volume factor (VCF) is then multiplied by ATR, creating a synergy with volatility and volume.
Visualization with Background Color Gradient:
A background color gradient is applied to the chart based on the calculated volume strength (f1).
The gradient color ranges from black (indicating low ATR and volume strength) to purple (indicating high ATR and volume strength). A low value indicates a ranging market with no significant price movements and it is safter to avoid signals generated from ROC histogram in these region.
Synergy of ROC and Volume Strength:
Observe how the ROC signals align with the background color gradient. For example, confirm whether positive ROC aligns with periods of high ATR and volume strength.
This synergy can provide confirmation or divergence signals, adding another layer of analysis.

Bollinger Bands (Nadaraya Smoothed) | Flux ChartsTicker: AMEX:SPY , Timeframe: 1m, Indicator settings: default
General Purpose
This script is an upgrade to the classic Bollinger Bands. The idea behind Bollinger bands is the detection of price movements outside of a stock's typical fluctuations. Bollinger Bands use a moving average over period n plus/minus the standard deviation over period n times a multiplier. When price closes above or below either band this can be considered an abnormal movement. This script allows for the classic Bollinger Band interpretation while de-noising or "smoothing" the bands.
Efficacy
Ticker: AMEX:SPY , Timeframe: 1m, Indicator settings: Standard Dev: 2; Level 1 : off; Level 2: off; labels: off
Upper Band Key:
Blue: Bollinger No smoothing
Orange: Bollinger SMA smoothing period of 10
Purple: Bollinger EMA smoothing period of 10
Red: Nadaraya Smoothed Bollinger bandwidth of 6
Here we chose periods so that each would have a similar offset from the original Bollinger's. Notice that the Red Band has a much smoother result while on average having a similar fit to the other smoothing techniques. Increasing the EMA's or SMA's period would result in them being smoother however the offset would increase making them less accurate to the original data.
Ticker: AMEX:SPY , Timeframe: 1m, Indicator settings: Standard Dev: 2; Level 1: off; Level 2: off; labels: off
Upper Band Key:
Blue: Bollinger No smoothing
Orange: Bollinger SMA smoothing period of 20
Purple: Bollinger EMA smoothing period of 20
Red: Nadaraya Smoothed Bollinger bandwidth of 6
This makes the Nadaraya estimator a particularly efficacious technique in this use case as it achieves a superior smoothness to fit ratio.
How to Use
This indicator is not intended to be used on its own. Its use case is to identify outlier movements and periods of consolidation. The Smoothing Factor when lowered results in a more reactive but noisy graph. This setting is also known as the "bandwidth" ; it essentially raises the amplitude of the kernel function causing a greater weighting to recent data similar to lowering the period of a SMA or EMA. The repaint smoothing simply draws on the Bollinger's each chart update. Typically repaint would be used for processing and displaying discrete data however currently it's simply another way to display the Bollinger Bands.
What makes this script unique.
Since Bollinger bands use standard deviation they have excess noise. By noise we mean minute fluctuations which most traders will not find useful in their strategies. The Nadaraya-Watson estimator, as used, is essentially a weighted average akin to an ema. A gaussian kernel is placed at the candlestick of interest. That candlestick's value will have the highest weight. From that point the other candlesticks' values effect on the average will decrease with the slope of the kernel function. This creates a localized mean of the Bollinger Bands allowing for reduced noise with minimal distortion of the original Bollinger data.

ATR Adaptive RSI OscillatorThe " ATR Adaptive RSI Oscillator " is a versatile technical analysis tool designed to help traders make informed decisions in dynamic market conditions. It combines the Relative Strength Index (RSI) with the Average True Range (ATR) to provide adaptive and responsive insights into price trends.
Key Features :
Adaptive RSI Periods : The indicator introduces the concept of adaptive RSI periods based on the ATR (Average True Range) of the market. When enabled, it dynamically adjusts the RSI calculation period, offering longer periods during high volatility and shorter periods during low volatility. This adaptability enhances the accuracy of RSI signals across varying market conditions.
Volume-Based Smoothing : The indicator includes a smoothing feature that computes a time-decayed weighted moving average of RSI values over the last two bars, using volume-based weights. This approach offers a time-sensitive smoothing effect, reducing noise for a clearer view of trend strength compared to the standard RSI.
Divergence Detection : Traders can enable divergence detection to identify potential reversal points in the market. The indicator highlights regular bullish and bearish divergences, providing valuable insights into market sentiment shifts.
Customizable Parameters : Traders have the flexibility to customize various parameters, including RSI length, adaptive mode, ATR length, and divergence settings, to tailor the indicator to their trading strategy.
Overbought and Oversold Levels : The indicator includes overbought (OB) and oversold (OS) boundary lines that can be adjusted to suit individual preferences. These levels help traders identify potential reversal zones.
The "ATR Adaptive RSI Oscillator" is a powerful tool for traders seeking to adapt their trading strategies to changing market dynamics. Whether you're a trend follower or a contrarian trader, this indicator provides valuable insights to support your decision-making process.
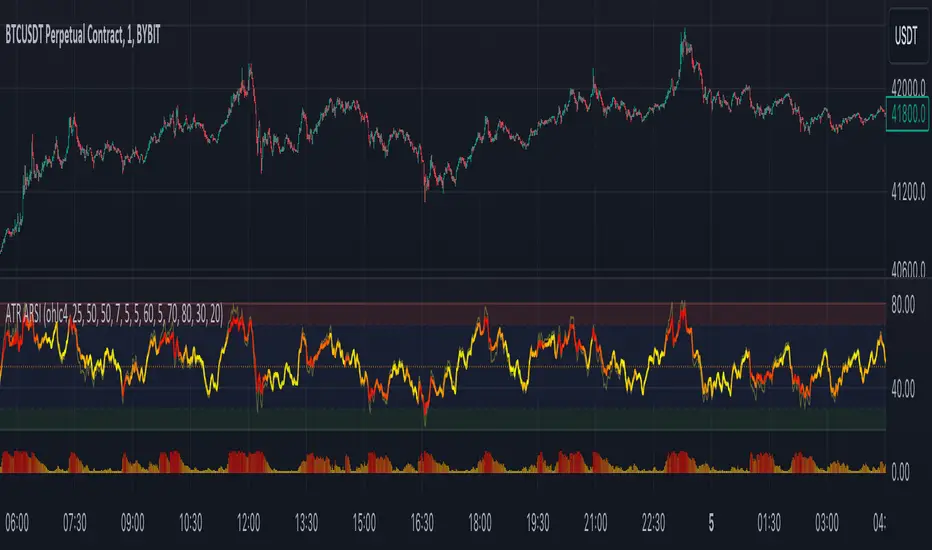
Discrete Fourier Transformed Money Flow IndexThe Discrete Fourier Transform Money Flow Index indicator integrates the Money Flow Index (MFI) with Discrete Fourier Transform (credit to author wbburgin - May 26 2023 ) smoothing to offer a refined and smoothed depiction of the MFI's underlying trend. The MFI is calculated using the formula: MFI = 100 - (100 / (1 + MR)), where a high MFI value indicates robust buying pressure (signaling an overbought condition), and a low MFI value indicates substantial selling pressure (signaling an oversold condition).
Why is the DFT and MFI combined?
The aim of this combination between DFT and MFI is to effectively filter out short-term fluctuations and noise, enabling a clearer assessment of the overall trend. This smoothing process enhances the reliability of the MFI by emphasizing dominant and sustained buying or selling pressures. This script executes a full DFT but only uses filtering from one frequency component. The choice to focus on the magnitude at index 0 is significant as it captures the dominant or fundamental frequency in the data. By analyzing this primary cyclic behavior, we can identify recurring patterns and potential turning points more easily. This streamlined approach simplifies interpretation and enhances efficiency by reducing complexity associated with multiple frequency components. Overall, focusing on the dominant frequency and applying it to the MFI provides a concise and actionable assessment of the underlying data.
Note: The FMFI indicator provides both smoothed and non-smoothed versions of the MFI, with the option to toggle the original non-smoothed MFI on or off in the settings.
Application
FMFI functions as a trend-following indicator. Bullish trends are denoted by the color white, while bearish trends are represented by the color purple. Circles plotted on the FMFI indicate regular bull and bear signals. Additionally, red arrows indicate a strong negative trend, while green arrows indicate a strong positive trend. These arrows are calculated based on the presence of regular bull and bear signals within overbought and oversold zones. To enhance its effectiveness, it is recommended to combine this indicator with other complementary technical analysis tools and integrate it into a comprehensive trading strategy. Traders are encouraged to explore a wide range of settings and timeframes to align the indicator with their unique trading preferences and adapt it to the current market conditions. By doing so, traders can optimize the indicator's performance and increase their potential for successful trading outcomes.
Utility
Traders and investors can employ this indicator to enhance their trend-following strategies. The white-colored components of the FMFI can help identify potential buying zones, while the purple-colored components can assist in identifying potential selling points. The red and green arrows can be used to pinpoint moments of strong bull or bear momentum, allowing traders to position themselves advantageously in their trading activities. Please note that future performance of any trading strategy is fundamentally unknowable, and past results do not guarantee future performance.

Ehlers Data Sampling Relative Strength Indicator [CC]The Data Sampling Indicator was created by John Ehlers (Stocks and Commodities Mar 2023) and this is a genius method to reduce noise in the market data but also doesn't introduce any lag while doing so. The way this works is because traditionally, people have always relied on the close price as the default input for many indicators such as the RSI or MACD as examples. Since the open is usually virtually identical to the previous close, it has been ignored by most people but Ehlers discovered that if you do a simple average of open and close for the input on any indicator, you can remove much of the noise without any added lag. I have used the RSI as he did in his example and plotted both to show the difference between the traditional RSI and using Ehlers' process as the new Data Sampling RSI. You can clearly see that this new RSI follows the price fluctuations much closer and is much smoother than the traditional RSI. As usual, I have included different colors to show the strength of the buy or sell signals so darker colors mean it is a very strong signal and lighter colors means it is a normal signal. Buy when the line turns green and sell when it turns red.
Feel free to try out this method to replace the input for any indicator and let me know how this works for you! And of course let me know if you would like me to publish any indicator script.
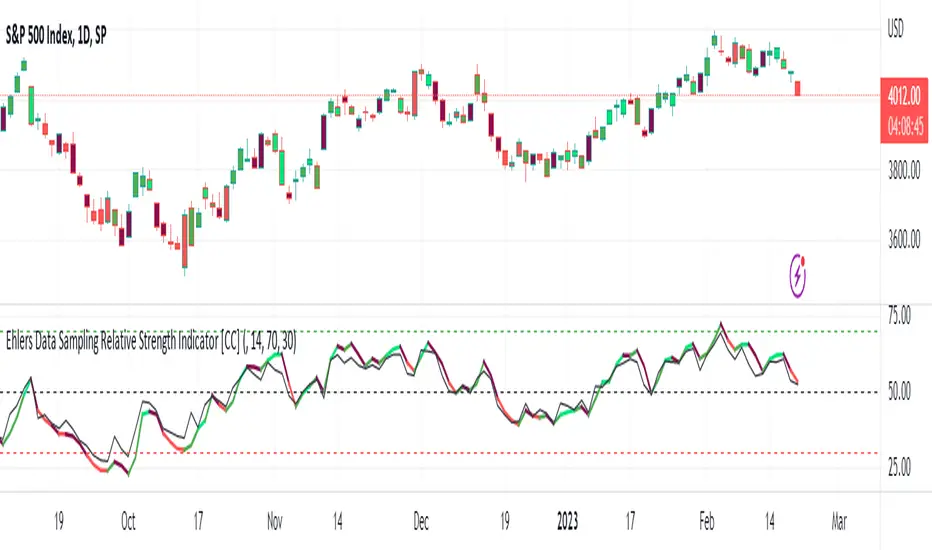
Renko Ichimoku CloudThis script utilizes its source from a non-repainting renko closing price. Renko charts focus solely on price movement and minimize the impacts of time and the extra noise time creates. Employing the renko close helps smooth out the Ichimoku Cloud. Insignificant price movements will not cause a change in the plotted lines of the indicator unless a new threshold is breached or a "brick" is created.
This Ichmoku Cloud includes all standard lines with standard lengths. These include:
Tenken Sen
Kiju Sen
Senkou A/B
Chikou Span
We have also included plotted marks for when there is a Tenken Sen/ Kiju Sen cross and for the Kumo cloud twist.
There are two methods for selecting the box size. Box size is critical for the overall function and efficacy of the plots you will visually see with this indicator. Box size is set automatically using the Average True Range "ATR" or manually using the "Traditional" setting. The simplest way to determine a manual box six is to take the ATR of the given instrument and round it to the nearest decimal place. As an example, if the ATR for the asset is 0.017, you would round that number to 0.02 and utilize this as your traditional box size.
NET BSP NET BSP derived from Buying & Selling Pressure which is a volatility indicator that monitors average metrics of green and red candles separately.
We could navigate more confidently through market with projected market balance.
BSP allowed us to track and analyze the ongoing performance of bullish and bearish impulsive waves and their corrections.
Due to unintuitive way of measuring decline with SP going up, I decided to remake it into more intuitive version with better precision.
When we encounter the fall it's better to have declining values of tool to be able to cover it visually with ease.
One of the solutions was to create a sense of balance of Buying Pressure against Selling Pressure.
Since we are oriented by growth, it'd be more logical to summarize the market balance with BP - SP
Comparison:
When Buying and Selling Pressure are equal, NET BSP would be at 0.
NETBSP > 0 and NETBSP > NETBSP = 🟢
NETBSP > 0 and NETBSP < NETBSP = 🟡
NETBSP < 0 and NETBSP < NETBSP = 🔴
NETBSP < 0 and NETBSP > NETBSP = 🟡
Hence, we get visualized stages of uptrends and downtrends which allows to evaluate chances and estimations of upcoming counter-waves.
Also, it is worth to note that output clearly shows how one wave is derived from another in terms of sizing.
Feel free to adjust NET BSP arguments to adapt sensitivity to the timeframe you're working on.

Library_SmoothersLibrary "Library_Smoothers"
CorrectedMA(Src, Len)
CorrectedMA The strengths of the corrected Average (CA) is that the current value of the time series must exceed a the current volatility-dependent threshold, so that the filter increases or falls, avoiding false signals when the trend is in a weak phase.
Parameters:
Src
Len
Returns: The Corrected source.
EHMA(src, len)
EMA Exponential Moving Average.
Parameters:
src : Source to act upon
len
Returns: EMA of source
FRAMA(src, len, FC, SC)
FRAMA Fractal Adaptive Moving Average
Parameters:
src : Source to act upon
len : Length of moving average
FC : Fast moving average
SC : Slow moving average
Returns: FRAMA of source
Jurik(src, length, phase, power)
Jurik A low lag filter
Parameters:
src : Source
length : Length for smoothing
phase : Phase range is ±100
power : Mathematical power to use. Doesn't need to be whole numbers
Returns: Jurik of source
SMMA(src, len)
SMMA Smoothed moving average. Think of the SMMA as a hybrid of its better-known siblings — the simple moving average (SMA) and the exponential moving average (EMA).
Parameters:
src : Source
len
Returns: SMMA of source
SuperSmoother(src, len)
SuperSmoother
Parameters:
src : Source to smooth
len
Returns: SuperSmoother of the source
TMA(src, len)
TMA Triangular Moving Average
Parameters:
src : Source
len
Returns: TMA of source
TSF(src, len)
TSF Time Series Forecast. Uses linear regression.
Parameters:
src : Source
len
Returns: TSF of source
VIDYA(src, len)
VIDYA Chande's Variable Index Dynamic Average. See www.fxcorporate.com
Parameters:
src : Source
len
Returns: VIDYA of source
VAWMA(src, len, startingWeight, volumeDefault)
VAWMA = VWMA and WMA combined. Simply put, this attempts to determine the average price per share over time weighted heavier for recent values. Uses a triangular algorithm to taper off values in the past (same as WMA does).
Parameters:
src : Source
len : Length
startingWeight
volumeDefault : The default value to use when a chart has no volume.
Returns: The VAWMA of the source.
WWMA(src, len)
WWMA Welles Wilder Moving Average
Parameters:
src : Source
len
Returns: The WWMA of the source
ZLEMA(src, len)
ZLEMA Zero Lag Expotential Moving Average
Parameters:
src : Source
len
Returns: The ZLEMA of the source
SmootherType(mode, src, len, fastMA, slowMA, offset, phase, power, startingWeight, volumeDefault, Corrected)
Performs the specified moving average
Parameters:
mode : Name of moving average
src : the source to apply the MA type
len
fastMA : FRAMA fast moving average
slowMA : FRAMA slow moving average
offset : Linear regression offset
phase : Jurik phase
power : Jurik power
startingWeight : VAWMA starting weight
volumeDefault : VAWMA default volume
Corrected
Returns: The MA smoothed source
