OPEN-SOURCE SCRIPT
已更新 Price Move exceed % Threshold & BE Evaluation -Tom1trader
https://www.tradingview.com/chart/OsBXckpZ/
Category is difficult with this one. I chose ROC as the closest as this measures the historical % of a given change amount.
This indicator is in a separate panel above or below the main chart. I use it only for Options trading to help with probability reckoning.
Use it (at your own risk) and the code freely and please ask any questions, glad to add detail / clarify and glad to know if you see I screwed something up. :-)
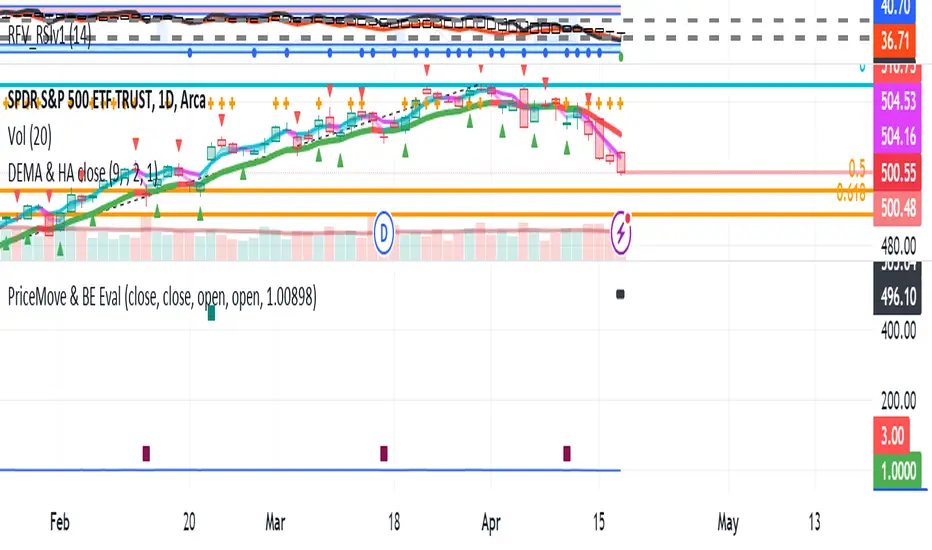
1. Plots when a percent move per candle is exceeded [from previous close] +exceeded is an "x" at top of panel and - is an "x" at panel bottom.
2. Plots (at last candle only) prices that are the selected % above and below the current close with thick black lines. TIP: For this to work best, in chart settings
"Scales" tab, check the "Indicator last value" and "No overlapping labels" check box.
3. Sums the number of times it occurs in a given number of candles ("Bars to sum . ." input).
TIP: On longer time frames (month+) reduce the length ("Bars . . sum" input) until get sums% plot.
4. Plots green and red lines for plus and minus sums as a percentage.
User inputs:
***** BTW did you know you can customize the time frame so one candle is (for example) 3 trading days?
1. Set the time frame of chart - NOTE this can be customized to what you need by scrolling to the bottom and adding the time frame you want i.e. 3 days or 2
weeks per candle. Remember these are trading times so 21 calendar days are 3 weeks or 15 trading days.
2. Choose the % threshold default 2% (+1.02 and its inverse for -) steps are 1/10th of a % (.001).
3. Choose the sum length("Bars . . sum . ") from 10 to 100 in number of candles.
Bottom line you can see the historical percentages and prices for a given percent move or can dial in a given break even (plus , minus or both) to see its past % occurrence and % move. One has to take into account changes in the market which show up clearly from the x above or below showing each occurrence (example: See more hits ("x"s) recently? Sum for recent length only to get more accurate reflection of market now.). Anyhow it is fun to play with and is part of how I do my own probability reckoning.
Category is difficult with this one. I chose ROC as the closest as this measures the historical % of a given change amount.
This indicator is in a separate panel above or below the main chart. I use it only for Options trading to help with probability reckoning.
Use it (at your own risk) and the code freely and please ask any questions, glad to add detail / clarify and glad to know if you see I screwed something up. :-)
1. Plots when a percent move per candle is exceeded [from previous close] +exceeded is an "x" at top of panel and - is an "x" at panel bottom.
2. Plots (at last candle only) prices that are the selected % above and below the current close with thick black lines. TIP: For this to work best, in chart settings
"Scales" tab, check the "Indicator last value" and "No overlapping labels" check box.
3. Sums the number of times it occurs in a given number of candles ("Bars to sum . ." input).
TIP: On longer time frames (month+) reduce the length ("Bars . . sum" input) until get sums% plot.
4. Plots green and red lines for plus and minus sums as a percentage.
User inputs:
***** BTW did you know you can customize the time frame so one candle is (for example) 3 trading days?
1. Set the time frame of chart - NOTE this can be customized to what you need by scrolling to the bottom and adding the time frame you want i.e. 3 days or 2
weeks per candle. Remember these are trading times so 21 calendar days are 3 weeks or 15 trading days.
2. Choose the % threshold default 2% (+1.02 and its inverse for -) steps are 1/10th of a % (.001).
3. Choose the sum length("Bars . . sum . ") from 10 to 100 in number of candles.
Bottom line you can see the historical percentages and prices for a given percent move or can dial in a given break even (plus , minus or both) to see its past % occurrence and % move. One has to take into account changes in the market which show up clearly from the x above or below showing each occurrence (example: See more hits ("x"s) recently? Sum for recent length only to get more accurate reflection of market now.). Anyhow it is fun to play with and is part of how I do my own probability reckoning.
發行說明
Count occurrences of price exceeding a chosen % move with up and down moves counted separately. Source in "from" period and target in "to" period selectable (i.e. How many times in last selected period has the price gone down and up from previous [choice ohlc] to current [choice ohlc] candle? More detail: In last 100 trading 1Ds from the close of one day until the open of the next day has price exceeded the selected percentage [.02 = 2%]? 1D in this case just means it is being used in the daily timeframe. Useful to determine how often your target or break even or stop loss etc. has been exceeded/hit in the past. Because you can look at each occurrence you can see the situation when it happened [up/down trend, reversal point, after exhaustion move and etc.開源腳本
秉持TradingView一貫精神,這個腳本的創作者將其設為開源,以便交易者檢視並驗證其功能。向作者致敬!您可以免費使用此腳本,但請注意,重新發佈代碼需遵守我們的社群規範。
免責聲明
這些資訊和出版物並非旨在提供,也不構成TradingView提供或認可的任何形式的財務、投資、交易或其他類型的建議或推薦。請閱讀使用條款以了解更多資訊。
開源腳本
秉持TradingView一貫精神,這個腳本的創作者將其設為開源,以便交易者檢視並驗證其功能。向作者致敬!您可以免費使用此腳本,但請注意,重新發佈代碼需遵守我們的社群規範。
免責聲明
這些資訊和出版物並非旨在提供,也不構成TradingView提供或認可的任何形式的財務、投資、交易或其他類型的建議或推薦。請閱讀使用條款以了解更多資訊。