INVITE-ONLY SCRIPT
PCCE + False Breakout Detector
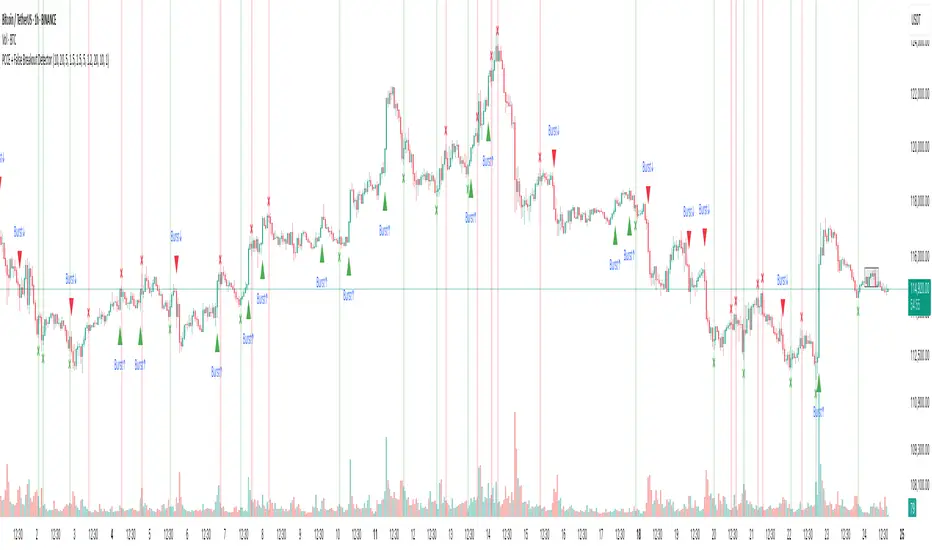
PCCE + False Breakout Detector
Type: Invite‑Only Indicator (closed source)
Purpose: Identify volatility compression (“coil”) and the first expansion after it, while filtering failed breakouts (bull/bear traps).
What it does — in plain language
This tool unifies two complementary behaviours that often appear back‑to‑back around strong moves:
1. Price Coil Compression & Expansion (PCCE) – finds compact ranges created by shrinking candle bodies, wick dominance, and contracting range relative to recent history. When price expands out of that coil with strength, it prints a Burst↑ / Burst↓ label.
2. False Breakout Detection – monitors recent swing extremes. If price closes beyond a prior high/low but re‑enters that range within a short window, it marks a trap (❌ red for failed bullish breakout, ❌ green for failed bearish breakout).
Why combine them?
PCCE tells you where the next move is likely brewing; the trap filter validates whether the breakout is genuine or failing. Used together they turn raw breakouts into structured, risk‑aware opportunities.
How it works — concepts behind the calculations
1) Detecting “Coil” (compression)
• Body contraction: Count of consecutive bars where |close-open| is decreasing within a sliding window.
• Wick dominance: Average (upper wick + lower wick) / body must exceed a threshold → indecision/liquidity probing.
• Relative range: Current high‑low over the window must be smaller than the average of prior windows (tight market).
• Coil zone: When the above conditions align, the most recent high/low envelope defines the coil’s bounds.
2) Confirming “Burst” (expansion)
A breakout through the coil high/low is only labelled when:
• Body thrust: current body > moving‑average body × multiplier (large real body).
• Relative volume: volume > moving‑average volume × multiplier (participation filter).
• Trend alignment (optional): close vs EMA to avoid counter‑trend bursts.
• Cooldown: minimum bars between signals to reduce clustering.
Result: Burst↑ if closing beyond coil high with thrust; Burst↓ if closing beyond coil low with thrust.
3) Flagging failed breakouts (traps)
• Track recent swing high/low from a lookback excluding the current bar.
• If a bar closes beyond that swing but within N bars price closes back inside the swing range → flag a trap:
• Bull trap: ❌ red above bar (break above failed)
• Bear trap: ❌ green below bar (break below failed)
⸻
What you see on the chart
• Coil zone: a shaded box (tight range envelope).
• Burst labels: Burst↑ (triangle up) and Burst↓ (triangle down) at confirmed expansion bars.
• Trap markers: ❌ red (failed bullish breakout), ❌ green (failed bearish breakout).
• Alerts: “Burst Up”, “Burst Down” (fires on bar close only).
⸻
How to use it
1. Preparation: When a coil box forms, mark the zone and wait.
2. Trigger: A Burst label confirms the first expansion with thrust/volume; treat it as an entry cue only within your own plan.
3. Validation: If a ❌ trap appears shortly after a break, treat it as caution/exit info; the breakout is failing.
4. Context: Best on 15m–4H. Combine with higher‑timeframe bias, nearby S/R, and risk controls.
5. Parameters to tune:
• Coil window, wick‑to‑body threshold, and range tightness
• Body/volume multipliers
• EMA trend filter on/off
• Trap lookback and confirmation bars
• Cooldown bars
⸻
Originality & usefulness
• Behaviour‑first compression scoring: Coil detection blends monotonic body shrink, wick dominance, and relative range contraction—not generic bands or a single oscillator.
• Two‑stage discipline: A burst is not just any break; it requires body thrust + relative volume (+ optional trend) to reduce noise.
• Immediate invalidation layer: The trap filter is evaluated right after the burst context, turning breakouts into risk‑aware signals rather than blind entries.
• Operator controls: Cooldown + multipliers let traders adapt the strictness to instrument/session behaviour.
⸻
Repainting & limitations
• Signals are evaluated on bar close; no lookahead, no request.security() with lookahead_on.
• Coil boxes while forming can update until confirmed; Burst/Trap labels do not repaint after their bar closes.
• News spikes and illiquid hours can still create noise; adjust multipliers and cooldown for your market.
⸻
Disclaimer
This indicator is an educational decision‑support tool, not financial advice. Markets are uncertain; past behaviour does not guarantee future results. Use with your own analysis and risk management.
僅限邀請腳本
僅作者批准的使用者才能訪問此腳本。您需要申請並獲得使用許可,通常需在付款後才能取得。更多詳情,請依照作者以下的指示操作,或直接聯絡TradeTechanalysis。
TradingView不建議在未完全信任作者並了解其運作方式的情況下購買或使用腳本。您也可以在我們的社群腳本中找到免費的開源替代方案。
作者的說明
To request access:
• Send me a private message on TradingView or
• Submit the form at http://www.tradetechanalysis.com (Indicator → PCCE + False Breakout Detector).
Thanks.
TradeTech Analysis
Telegram Channel - t.me/Tradetech2024
Youtube Channel - youtube.com/@TradeTechAnalysis
Website - tradetechanalysis.com/
Super Profile - superprofile.bio/tradetechanalysis
TradeTech Analysis
Telegram Channel - t.me/Tradetech2024
Youtube Channel - youtube.com/@TradeTechAnalysis
Website - tradetechanalysis.com/
Super Profile - superprofile.bio/tradetechanalysis
免責聲明
這些資訊和出版物並非旨在提供,也不構成TradingView提供或認可的任何形式的財務、投資、交易或其他類型的建議或推薦。請閱讀使用條款以了解更多資訊。