OPEN-SOURCE SCRIPT
Displacement [QuantVue]
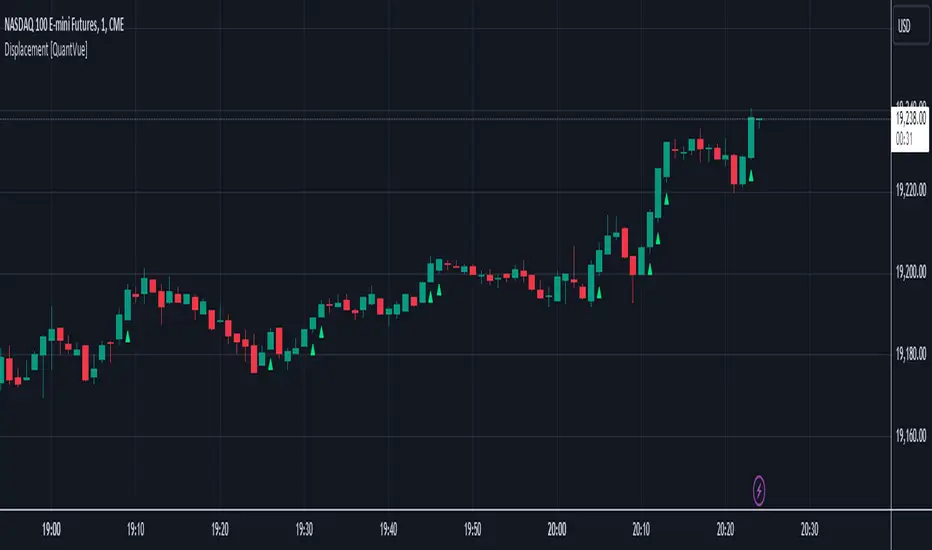
Displacement refers to a significant and forceful price movement that indicates a potential shift in market sentiment or trend. Displacement is characterized by a strong push in price action, often seen after a period of consolidation or within a trending market. It is a key concept used to identify the strength of a move and to confirm the direction of the market.
The "Displacement" indicator does this by focusing on identifying strong, directional price movements by combining candlestick analysis with volatility (ATR).
Displacement often appears as a group of candles that are all positioned in the same direction, these candles typically have large bodies and short wicks.
How the indicator works:
Body Size Requirement: Ensures that only candles with a significant body size (relative to their total range) are considered, helping to identify strong market moves.
Consecutive Candle Analysis: Identifies shifts in market sentiment by requiring a series of consecutive bullish or bearish candles to confirm a potential change in trend.
ATR-Based Analysis:Uses the Average True Range (ATR) to gauge market volatility and filter out minor price fluctuations, focusing on substantial movements.
Once all of the requirements are met a triangle is plotted above or below the bar.
開源腳本
秉持TradingView一貫精神,這個腳本的創作者將其設為開源,以便交易者檢視並驗證其功能。向作者致敬!您可以免費使用此腳本,但請注意,重新發佈代碼需遵守我們的社群規範。
Get Access to the exclusive QuantVue indicators: quantvue.io/
Join thousands of traders in our Free Discord: discord.gg/tC7u7magU3
Join thousands of traders in our Free Discord: discord.gg/tC7u7magU3
免責聲明
這些資訊和出版物並非旨在提供,也不構成TradingView提供或認可的任何形式的財務、投資、交易或其他類型的建議或推薦。請閱讀使用條款以了解更多資訊。