OPEN-SOURCE SCRIPT
Energy_Arrows[Salty]
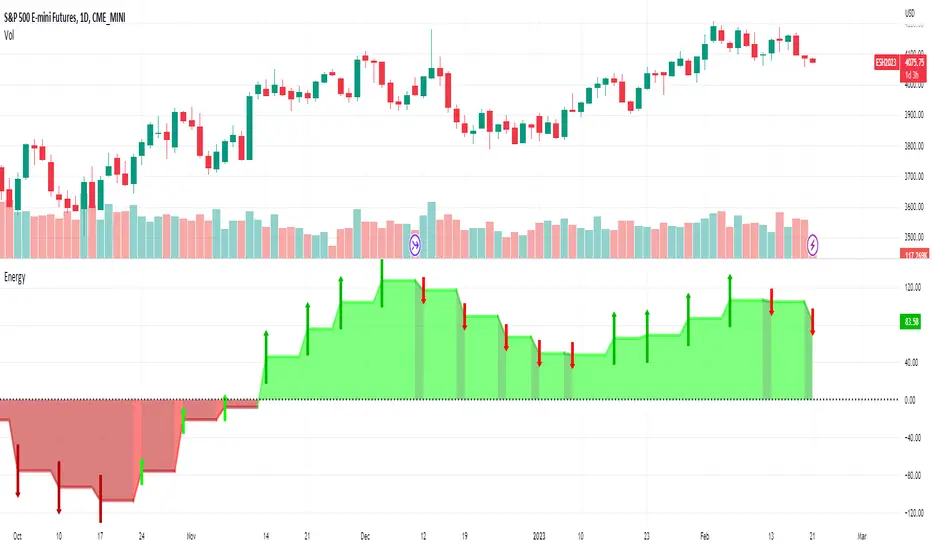
This script quantifies the energy in a price move by comparing the relationship of 3 configurable exponential moving averages present on a slightly higher timeframe (chosen automatically based on the charts current period). It uses the closing price by default, but this is also configurable using the Source input. There are a few ways to use the information in this indicator. One is to use the values above zero (colored green) to provide a bullish bias for future price, and values below zero (colored red) indicating a bearish bias for future prices. This bias can be shown to be increasing or decreasing base on the upward or downward slope of the indicator. The green and red arrows can be enabled to show if the bias is strengthening or weakening based on the direction they are pointing. Finally, the height changes in the peaks of the indicator can be used to show divergence in the strength of extreme price moves to show when a pull back or reversal may occur.
開源腳本
秉持TradingView一貫精神,這個腳本的創作者將其設為開源,以便交易者檢視並驗證其功能。向作者致敬!您可以免費使用此腳本,但請注意,重新發佈代碼需遵守我們的社群規範。
免責聲明
這些資訊和出版物並非旨在提供,也不構成TradingView提供或認可的任何形式的財務、投資、交易或其他類型的建議或推薦。請閱讀使用條款以了解更多資訊。
開源腳本
秉持TradingView一貫精神,這個腳本的創作者將其設為開源,以便交易者檢視並驗證其功能。向作者致敬!您可以免費使用此腳本,但請注意,重新發佈代碼需遵守我們的社群規範。
免責聲明
這些資訊和出版物並非旨在提供,也不構成TradingView提供或認可的任何形式的財務、投資、交易或其他類型的建議或推薦。請閱讀使用條款以了解更多資訊。