INVITE-ONLY SCRIPT
已更新 MTF Dots BTC-Pair [Auto] [Moto]
Hello traders,
Rsi is pretty commonly used and for some good reasons. When I'm trading, I don't always want to use the USDT/USDTPERP rsi, I want to see the correlated BTC pair Rsi of that asset
This script is similar to my MTF Dots and MTF Dots Cor scripts, but with an important and crucial distinction.
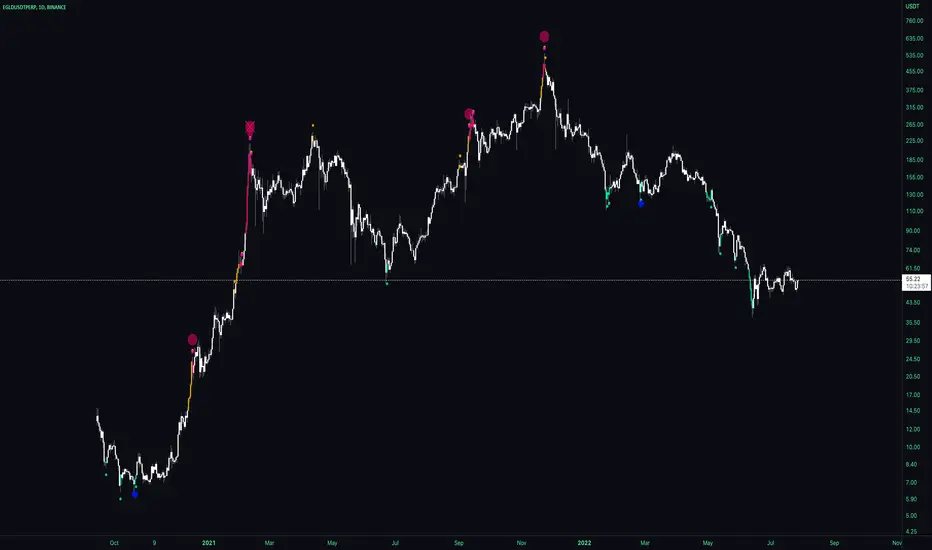
This shows user input oversold and overbought RSI metrics for multiple simultaneous timeframes comparatively to a perpetual futures contracts respective BTC pair automatically.
IMPORTANT: As of posting, the script will only show relevant information if the observed chart is a Binance perp chart. Any other chart and the script will not show data.
For example, if a user is on the BINANCE:SOLUSDTPERP chart, the script will show oversold and overbought Rsi data points for BINANCE:SOLBTC. If observing the BINANCE:ZRXUSDTPERP chart, it will give metrics for BINANCE:ZRXBTC Rsi.
There are six time frames, set to "Chart" resolution by default, which have individual period, overbought and oversold levels of strength.


DM for access,
Thanks
Rsi is pretty commonly used and for some good reasons. When I'm trading, I don't always want to use the USDT/USDTPERP rsi, I want to see the correlated BTC pair Rsi of that asset
This script is similar to my MTF Dots and MTF Dots Cor scripts, but with an important and crucial distinction.
This shows user input oversold and overbought RSI metrics for multiple simultaneous timeframes comparatively to a perpetual futures contracts respective BTC pair automatically.
IMPORTANT: As of posting, the script will only show relevant information if the observed chart is a Binance perp chart. Any other chart and the script will not show data.
For example, if a user is on the BINANCE:SOLUSDTPERP chart, the script will show oversold and overbought Rsi data points for BINANCE:SOLBTC. If observing the BINANCE:ZRXUSDTPERP chart, it will give metrics for BINANCE:ZRXBTC Rsi.
There are six time frames, set to "Chart" resolution by default, which have individual period, overbought and oversold levels of strength.
DM for access,
Thanks
發行說明
Included confluence filter via candle direction. Organized inputs into resolutions. Slight edit to first OS/OB level發行說明
Added tickers發行說明
Tweaked default values, added addition signal of conviction. Fixed typos. 發行說明
Added alerts for "Valley" and "Peak"DM for access.
Follow on Twitter for updates.
One time fee, no subscription
twitter.com/IntroMoto
Follow on Twitter for updates.
One time fee, no subscription
twitter.com/IntroMoto
免責聲明
這些資訊和出版物並不意味著也不構成TradingView提供或認可的金融、投資、交易或其他類型的意見或建議。請在使用條款閱讀更多資訊。
DM for access.
Follow on Twitter for updates.
One time fee, no subscription
twitter.com/IntroMoto
Follow on Twitter for updates.
One time fee, no subscription
twitter.com/IntroMoto
免責聲明
這些資訊和出版物並不意味著也不構成TradingView提供或認可的金融、投資、交易或其他類型的意見或建議。請在使用條款閱讀更多資訊。