INVITE-ONLY SCRIPT
已更新 HHLL and Liquidity Levels

HHLL AND Liquidity Levels
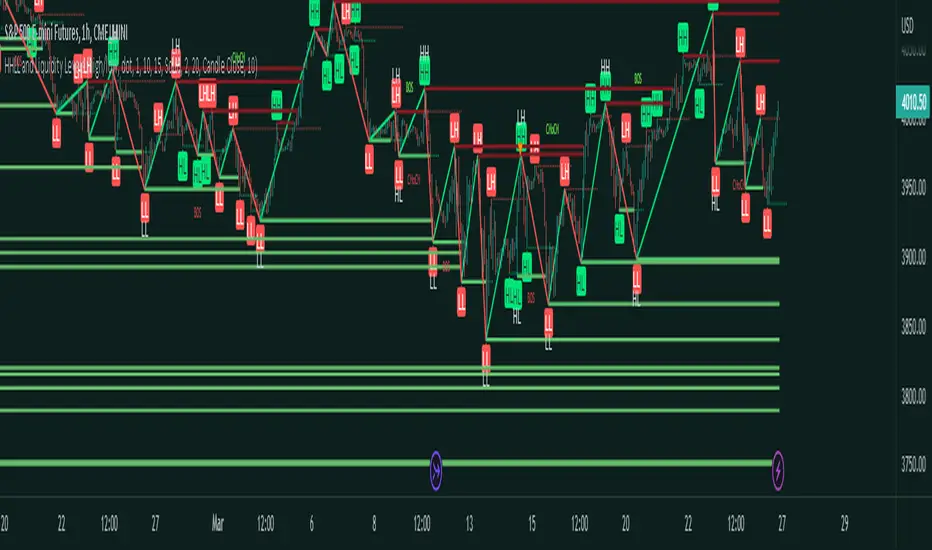
Description: This indicator shows hidden support and resistance levels and liquidity levels. The indicator allows traders to select source data from open/close or the high and low. The indicator also allows for appearance customization.
How can Higher highs and Lower lows and liquidity levels benefit traders?
HHLL refers to a series of higher highs and lower lows in an asset's price trend, which can indicate a potential reversal in the trend. Liquidity, on the other hand, refers to the ease with which an asset can be bought or sold without affecting its price. HHLL can help traders identify potential trends, while liquidity can ensure that trades can be executed smoothly and without significant price impact.
How can traders use this indicator?
Traders can use the indicator to identify potential market trends and market momentum. When the indicator show a series of higher highs and higher lows it can show a possible uptrend, meanwhile a series of lower lows and lower highs could show a possible uptrend with liquidity to confirm their trading decisions.
The script could also capture hidden support and resistance levels by showing areas where liquidity is concentrated and where price has repeatedly made higher highs and lower lows.
Features:
Here are some examples of the indicator in action:

The HHLL and Liquidity Levels indicator being used with the Contraction and Expansion indicator to see when expansions are due and then price retest the liquidity levels.

Description: This indicator shows hidden support and resistance levels and liquidity levels. The indicator allows traders to select source data from open/close or the high and low. The indicator also allows for appearance customization.
How can Higher highs and Lower lows and liquidity levels benefit traders?
HHLL refers to a series of higher highs and lower lows in an asset's price trend, which can indicate a potential reversal in the trend. Liquidity, on the other hand, refers to the ease with which an asset can be bought or sold without affecting its price. HHLL can help traders identify potential trends, while liquidity can ensure that trades can be executed smoothly and without significant price impact.
How can traders use this indicator?
Traders can use the indicator to identify potential market trends and market momentum. When the indicator show a series of higher highs and higher lows it can show a possible uptrend, meanwhile a series of lower lows and lower highs could show a possible uptrend with liquidity to confirm their trading decisions.
The script could also capture hidden support and resistance levels by showing areas where liquidity is concentrated and where price has repeatedly made higher highs and lower lows.
Features:
- Support and Resistance levels based on Highs and Lows
- Zig zags to show the HHLL's
- Liquidity Levels
- BOS and CHOCHS labels
Here are some examples of the indicator in action:
The HHLL and Liquidity Levels indicator being used with the Contraction and Expansion indicator to see when expansions are due and then price retest the liquidity levels.
發行說明
Description Update僅限邀請腳本
僅作者批准的使用者才能訪問此腳本。您需要申請並獲得使用許可,通常需在付款後才能取得。更多詳情,請依照作者以下的指示操作,或直接聯絡Traders_Endeavors。
TradingView不建議在未完全信任作者並了解其運作方式的情況下購買或使用腳本。您也可以在我們的社群腳本中找到免費的開源替代方案。
作者的說明
Get instant access here: https://www.patreon.com/user?u=80987417
Link Tree: linktr.ee/tradersendeavors
Access our indicators: patreon.com/user?u=80987417
Access our indicators: patreon.com/user?u=80987417
免責聲明
這些資訊和出版物並非旨在提供,也不構成TradingView提供或認可的任何形式的財務、投資、交易或其他類型的建議或推薦。請閱讀使用條款以了解更多資訊。
僅限邀請腳本
僅作者批准的使用者才能訪問此腳本。您需要申請並獲得使用許可,通常需在付款後才能取得。更多詳情,請依照作者以下的指示操作,或直接聯絡Traders_Endeavors。
TradingView不建議在未完全信任作者並了解其運作方式的情況下購買或使用腳本。您也可以在我們的社群腳本中找到免費的開源替代方案。
作者的說明
Get instant access here: https://www.patreon.com/user?u=80987417
Link Tree: linktr.ee/tradersendeavors
Access our indicators: patreon.com/user?u=80987417
Access our indicators: patreon.com/user?u=80987417
免責聲明
這些資訊和出版物並非旨在提供,也不構成TradingView提供或認可的任何形式的財務、投資、交易或其他類型的建議或推薦。請閱讀使用條款以了解更多資訊。