PROTECTED SOURCE SCRIPT
已更新 Machine Learning RSI Bands
"Machine Learning RSI Bands" Indicator
The "Machine Learning RSI Bands" (MLRSIB) indicator leverages advanced algorithmic analysis to enhance traditional RSI strategies:
RSI Customization: Users can customize the RSI settings including source, length, and thresholds for overbought/oversold conditions.
Innovative Machine Learning Application: The script uses a proprietary function FOUNDATION_400x10x2 from the 'FOUNDATION' library, which analyzes the last 400 occurrences of data points, considering various market dynamics like volume changes or RSI movements based on the selected sampling method. Outputs four optimal outcomes for both upper and lower band conditions, representing the most statistically significant patterns or predictions.
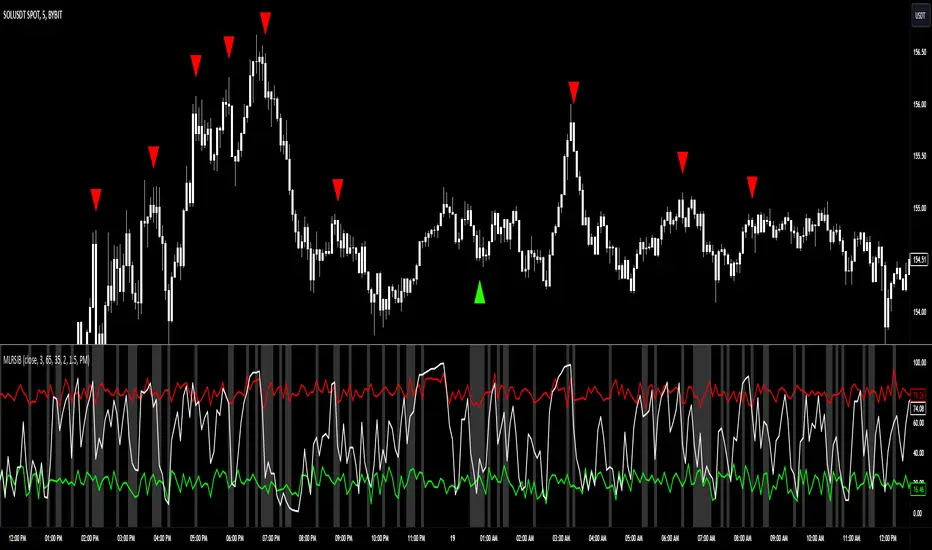
Dynamic Band Visualization: Plots the average of these four outcomes as colored lines (red for the upper band, green for the lower band) on the chart, serving as dynamic support and resistance or overbought/oversold levels.
Signal Plotting: Displays triangles above or below the bars to signal potential short or long entries when the RSI crosses these machine learning-adjusted bands under certain confidence conditions.
Market Volatility Indicator: Adjusts the chart's background color based on volatility, using an average deviation analysis to gauge market calmness or agitation.
Alert System: Provides alert conditions for when these sophisticated signals are triggered, allowing for timely trading actions.
This indicator is designed for traders interested in combining traditional technical analysis with machine learning to refine their market entry and exit strategies, focusing on patterns identified from recent market behavior.
The "Machine Learning RSI Bands" (MLRSIB) indicator leverages advanced algorithmic analysis to enhance traditional RSI strategies:
RSI Customization: Users can customize the RSI settings including source, length, and thresholds for overbought/oversold conditions.
Innovative Machine Learning Application: The script uses a proprietary function FOUNDATION_400x10x2 from the 'FOUNDATION' library, which analyzes the last 400 occurrences of data points, considering various market dynamics like volume changes or RSI movements based on the selected sampling method. Outputs four optimal outcomes for both upper and lower band conditions, representing the most statistically significant patterns or predictions.
Dynamic Band Visualization: Plots the average of these four outcomes as colored lines (red for the upper band, green for the lower band) on the chart, serving as dynamic support and resistance or overbought/oversold levels.
Signal Plotting: Displays triangles above or below the bars to signal potential short or long entries when the RSI crosses these machine learning-adjusted bands under certain confidence conditions.
Market Volatility Indicator: Adjusts the chart's background color based on volatility, using an average deviation analysis to gauge market calmness or agitation.
Alert System: Provides alert conditions for when these sophisticated signals are triggered, allowing for timely trading actions.
This indicator is designed for traders interested in combining traditional technical analysis with machine learning to refine their market entry and exit strategies, focusing on patterns identified from recent market behavior.
發行說明
Input Reorder發行說明
Updated Confidence Reasoning受保護腳本
此腳本以閉源形式發佈。 不過,您可以自由使用,沒有任何限制 — 點擊此處了解更多。
免責聲明
這些資訊和出版物並非旨在提供,也不構成TradingView提供或認可的任何形式的財務、投資、交易或其他類型的建議或推薦。請閱讀使用條款以了解更多資訊。
免責聲明
這些資訊和出版物並非旨在提供,也不構成TradingView提供或認可的任何形式的財務、投資、交易或其他類型的建議或推薦。請閱讀使用條款以了解更多資訊。