OPEN-SOURCE SCRIPT
Multi-Exchange Volume w Candle Highlight
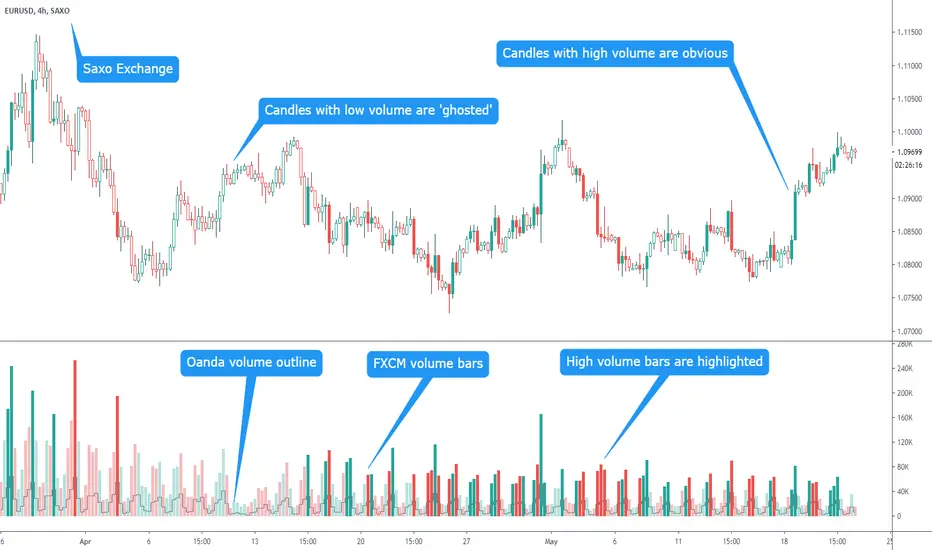
I've been investigating the value of studying candle volume. I realised all the exchanges give different volume. So I've made an indicator that shows the volume from multiple exchanges.
You can choose a primary exchange for the main changes and a secondary exchange for a line chart in front. These exchanges are INDEPENDANT of the exchange you are looking at so if your broker does not show volume, you can use the volume supplied by another broker who does. For example, you might be looking at a chart from Saxo exchange (who I don't think supplies volume) but see volume from FXCM as the primary with pattern confirmation from Oanda as the secondary.
You'll can see the patterns are the same but FXCM has higher overall volume than Oanda
In addition you can choose to highlight the high volume bars and highlight the high volume candles.
I find it useful as I can look at a move and easily see whether there is volume behind it - if there is a move with low volume is it sustainable?
You have the option to switch all the extra features on and off so if you prefer you can just look at a classic volume chart whilst looking at a candle chart from an exchange that does not supply volume.
I'm honest as to whether I find my scripts useful in my trading (they are always technically correct) or not and I think this one is good.
開源腳本
秉持TradingView一貫精神,這個腳本的創作者將其設為開源,以便交易者檢視並驗證其功能。向作者致敬!您可以免費使用此腳本,但請注意,重新發佈代碼需遵守我們的社群規範。
免責聲明
這些資訊和出版物並非旨在提供,也不構成TradingView提供或認可的任何形式的財務、投資、交易或其他類型的建議或推薦。請閱讀使用條款以了解更多資訊。
開源腳本
秉持TradingView一貫精神,這個腳本的創作者將其設為開源,以便交易者檢視並驗證其功能。向作者致敬!您可以免費使用此腳本,但請注意,重新發佈代碼需遵守我們的社群規範。
免責聲明
這些資訊和出版物並非旨在提供,也不構成TradingView提供或認可的任何形式的財務、投資、交易或其他類型的建議或推薦。請閱讀使用條款以了解更多資訊。