OPEN-SOURCE SCRIPT
Support and Resistance: Triangles [YinYangAlgorithms]
Overview:
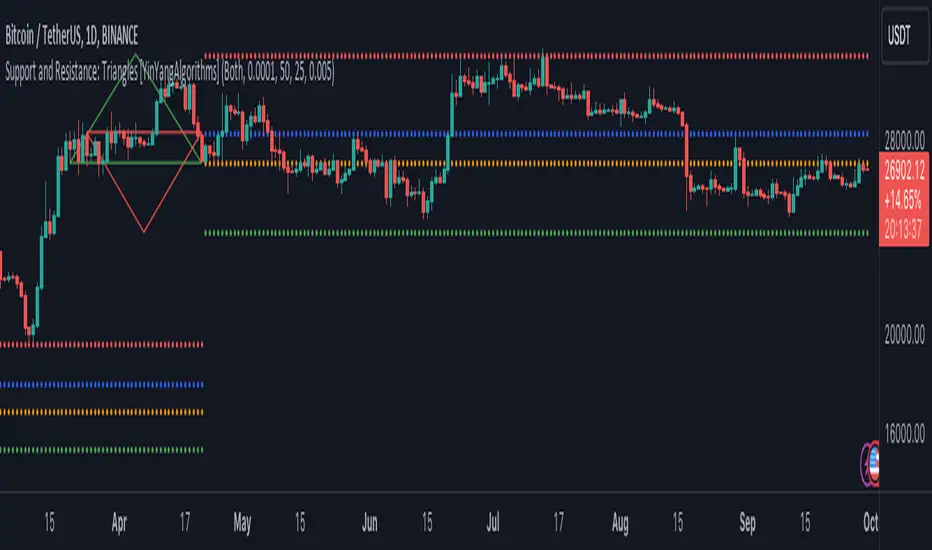
Triangles have always been known to be the strongest shape. Well, why wouldn’t that likewise apply to trading? This Indicator will create Upwards and Downwards Triangles which in turn create Support and Resistance locations. For example, we find 2 highs that meet the criteria (within deviation %, Minimum Distance and Lookback Distance). We calculate the distance between these two and create an Equilateral Triangle Downwards (You can adjust the % if you want more of an Isosceles Triangle). The midpoint (tip) of this triangle is the Support and the bottom (base) of it is the Resistance. The exact opposite applies for an Upwards Triangle.
The reason why Triangles may make for good Support and Resistance locations is the % 's used, much like the fibonacci, use ratios relevant in nature and everywhere in the world around us, so why not for trading too?
Tutorial:

If you look at the locations we’ve circled above, all of them exhibit strong rejections are predictive Support and Resistance locations plotted by the triangles created. There can only ever be 1 Upward and 1 Downward Triangle at a time, so when a new one is created, the Support and Resistance locations are moved.

If you scroll back far enough you’ll notice the Triangles disappear but their Support and Resistance locations are still plotted. This has to do with the fact you are allowed only so many Lines plotted and when a new Triangle is created, an old one will be removed. The Support and Resistance locations however will stay.
If we look at the example above, you can see the Support and Resistance locations the Triangles made here may have helped predict where the price would struggle to surpass.

By default the Look Back Distance is set to 50 and the Min Distance is 10 (settings used in all previous examples). However, you can modify these to make Triangles more ‘Rare’ and therefore the Support and Resistance locations change less. In the example above for Instance we left Look Back Distance to 50 but changed Min Distance from 10 to 25. This results in Support and Resistance locations that may hold better in the long term.

If we scroll back a bit, we can see the settings ‘Look Back Distance’ 50 and ‘Minimum Distance’ 25 had done a decent job at predicting the ATH resistance and many Support and Resistance locations around it. Keep in mind, previous results don’t mean future results, but Triangles may create ratios which apply well to trading.
We will conclude our Tutorial here. Hopefully you can see the benefit to the ratio Triangles make when predicting Support and Resistance locations.
Settings:
If you have any questions, comments, ideas or concerns please don't hesitate to contact us.
HAPPY TRADING!
Triangles have always been known to be the strongest shape. Well, why wouldn’t that likewise apply to trading? This Indicator will create Upwards and Downwards Triangles which in turn create Support and Resistance locations. For example, we find 2 highs that meet the criteria (within deviation %, Minimum Distance and Lookback Distance). We calculate the distance between these two and create an Equilateral Triangle Downwards (You can adjust the % if you want more of an Isosceles Triangle). The midpoint (tip) of this triangle is the Support and the bottom (base) of it is the Resistance. The exact opposite applies for an Upwards Triangle.
The reason why Triangles may make for good Support and Resistance locations is the % 's used, much like the fibonacci, use ratios relevant in nature and everywhere in the world around us, so why not for trading too?
Tutorial:
If you look at the locations we’ve circled above, all of them exhibit strong rejections are predictive Support and Resistance locations plotted by the triangles created. There can only ever be 1 Upward and 1 Downward Triangle at a time, so when a new one is created, the Support and Resistance locations are moved.
If you scroll back far enough you’ll notice the Triangles disappear but their Support and Resistance locations are still plotted. This has to do with the fact you are allowed only so many Lines plotted and when a new Triangle is created, an old one will be removed. The Support and Resistance locations however will stay.
If we look at the example above, you can see the Support and Resistance locations the Triangles made here may have helped predict where the price would struggle to surpass.
By default the Look Back Distance is set to 50 and the Min Distance is 10 (settings used in all previous examples). However, you can modify these to make Triangles more ‘Rare’ and therefore the Support and Resistance locations change less. In the example above for Instance we left Look Back Distance to 50 but changed Min Distance from 10 to 25. This results in Support and Resistance locations that may hold better in the long term.
If we scroll back a bit, we can see the settings ‘Look Back Distance’ 50 and ‘Minimum Distance’ 25 had done a decent job at predicting the ATH resistance and many Support and Resistance locations around it. Keep in mind, previous results don’t mean future results, but Triangles may create ratios which apply well to trading.
We will conclude our Tutorial here. Hopefully you can see the benefit to the ratio Triangles make when predicting Support and Resistance locations.
Settings:
- Show Triangles: If all you want to know is the Support and Resistance locations, there’s no need to draw the Triangles.
- Triangle Zones: What types of triangles should we create our zones for? Options are Upward, Downward, Both, None.
- Max Deviation Allowed: Maximum Deviation up or down from the last bars High/Low for potential to create a Triangle.
- Lookback Distance: How far back we look to see for potential of a High/Low within Deviation range.
- Min Distance: This is so triangles are spaced properly and not from 2 bars beside each other. Min distance allocated between 2 points to create a Triangle.
- Bar Percent Increase: How much % multiplier do we apply for each bar spacing of the triangle. 0.005 creates a close to Equilateral Triangle, but other values like 0.004 and 0.006 seem to work well too.
If you have any questions, comments, ideas or concerns please don't hesitate to contact us.
HAPPY TRADING!
開源腳本
本著TradingView的真正精神,此腳本的創建者將其開源,以便交易者可以查看和驗證其功能。向作者致敬!雖然您可以免費使用它,但請記住,重新發佈程式碼必須遵守我們的網站規則。
Follow us for Free Indicators and Strategies released weekly!
Visit our website to purchase our Premium Indicators and Strategies. Try for 7 days risk free!
YinYangAlgorithms.com
Join our Discord Community: discord.gg/ccEHem37FB
Visit our website to purchase our Premium Indicators and Strategies. Try for 7 days risk free!
YinYangAlgorithms.com
Join our Discord Community: discord.gg/ccEHem37FB
免責聲明
這些資訊和出版物並不意味著也不構成TradingView提供或認可的金融、投資、交易或其他類型的意見或建議。請在使用條款閱讀更多資訊。