PROTECTED SOURCE SCRIPT
Scalperstool v1.0_Ramesh0296
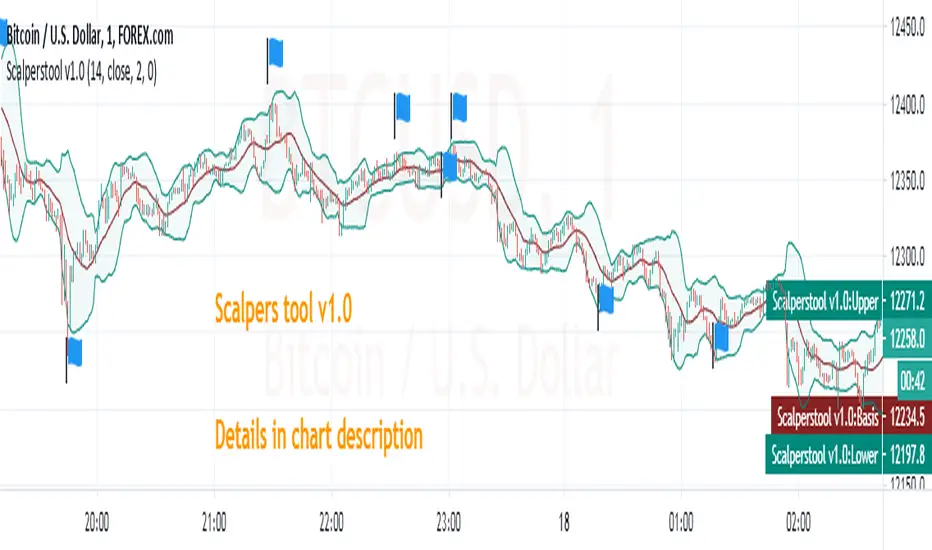
Scalperstool v1.0
This indicator can use for scalp in Highly liquid stocks,indices and currencies
What here i used ?
Here i used Bollinger bands with Modified Relative Strength Index (n=2)
How to use it ?
Apply scalperstool v1.0 in chart
Time frame 1min
once you applied 3 lines will plotted on chart but the value dimensions shows 4 value in top left side on the chart
first 3 values related to bollinger bands(here i used it for dynamic support and resistance). the last value shows modified RSI value
CONDITIONS
CONDITION 1
1 min candle should close and it must showing below value
safe Players
Buy condition (too safe) : RSI value should be less than or equal to 3
Sell condition (too safe) : RSI value should be greater than or equal to 97
Moderate Risk takers
Buy condition : RSI value should be less than or equal to 10
Sell condition : RSI value should be greater than or equal to 90
Most of the time the value above mentioned equals to bollinger upper band(overbought) and lower band(oversold) zones
CONDITION 2
May scalp alone with 1st condition but my favorite is i combined above condition with this one
This is too simple that 1 min candle should close with long upper wick or long lower wick & mostly its open equals to high looks like a hammer but not exact one.
I flag some good trades in chart.
STOP LOSS SHOULD BE ENTRY CANDLE'S PREVIOUS ONE LOW OR HIGH.
--------------------------------------------------------------------------------------------------------------------------
LIKE & FOLLOW TO SHOW YOUR LOVE & SUPPORT AND ALSO TO GET MORE TRADE IDEAS AND SCRIPTS
**Educational Purpose only
受保護腳本
此腳本以閉源形式發佈。 不過,您可以自由使用,沒有任何限制 — 點擊此處了解更多。
免責聲明
這些資訊和出版物並非旨在提供,也不構成TradingView提供或認可的任何形式的財務、投資、交易或其他類型的建議或推薦。請閱讀使用條款以了解更多資訊。
受保護腳本
此腳本以閉源形式發佈。 不過,您可以自由使用,沒有任何限制 — 點擊此處了解更多。
免責聲明
這些資訊和出版物並非旨在提供,也不構成TradingView提供或認可的任何形式的財務、投資、交易或其他類型的建議或推薦。請閱讀使用條款以了解更多資訊。