OPEN-SOURCE SCRIPT
Risk On Risk Off
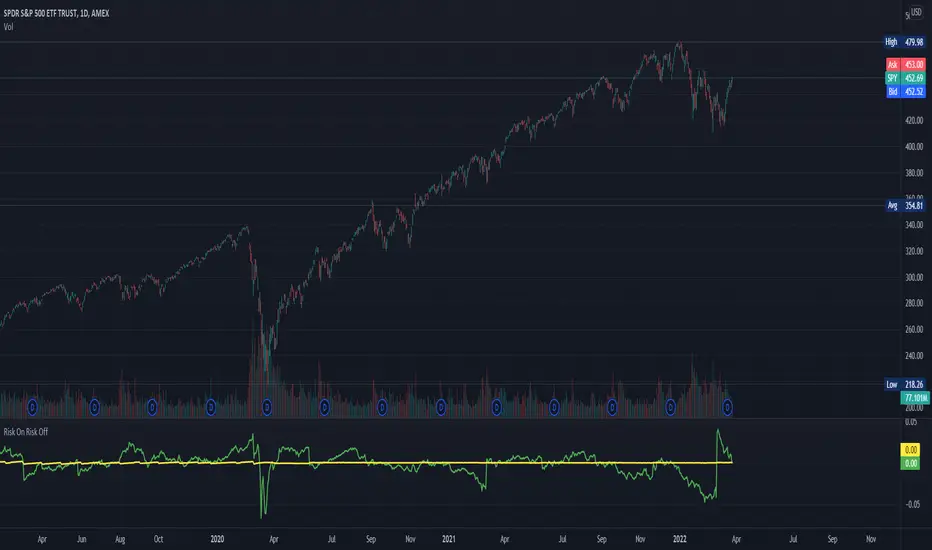
A helpful indicator for those who follow a systematic long-term investment approach.
What it shows:
It shows the 60 Day Cumulative Return of BND Vanguard Total Bond Market ETF against the 60 Day Cumulative Return of
  BIL SPDR Bloomberg Barclays 1-3 Month T-Bill ETF.
Why:
This Indicator will provide you a sense of where the economic environment is at, if the indicator shows that the 60 Day Cumulative return ofBND is ABOVE BIL, it means that it's a good idea to go Risk ON in the stock market; On the other hand, if the inverse is true, it means that is a good idea to go Risk OFF in the stock market.
Example Uses:
Warren Buffet often advice Investors to just buy a S&P500 index tracking ETF likeSPY consistently and you will likely to be making money in the long-term.
With this indicator you will be able to make the Buffet Strategy even simpler: when the indicator shows Risk ON, buy theSPY; when the indicator shows Risk OFF, consider hedges like  IEF iShares 7-10 Year Treasury Bond ETF.SPY
What it shows:
It shows the 60 Day Cumulative Return of
Why:
This Indicator will provide you a sense of where the economic environment is at, if the indicator shows that the 60 Day Cumulative return of
Example Uses:
Warren Buffet often advice Investors to just buy a S&P500 index tracking ETF like
With this indicator you will be able to make the Buffet Strategy even simpler: when the indicator shows Risk ON, buy the
開源腳本
秉持TradingView一貫精神,這個腳本的創作者將其設為開源,以便交易者檢視並驗證其功能。向作者致敬!您可以免費使用此腳本,但請注意,重新發佈代碼需遵守我們的社群規範。
免責聲明
這些資訊和出版物並非旨在提供,也不構成TradingView提供或認可的任何形式的財務、投資、交易或其他類型的建議或推薦。請閱讀使用條款以了解更多資訊。
免責聲明
這些資訊和出版物並非旨在提供,也不構成TradingView提供或認可的任何形式的財務、投資、交易或其他類型的建議或推薦。請閱讀使用條款以了解更多資訊。