OPEN-SOURCE SCRIPT
已更新 RSI & RVI
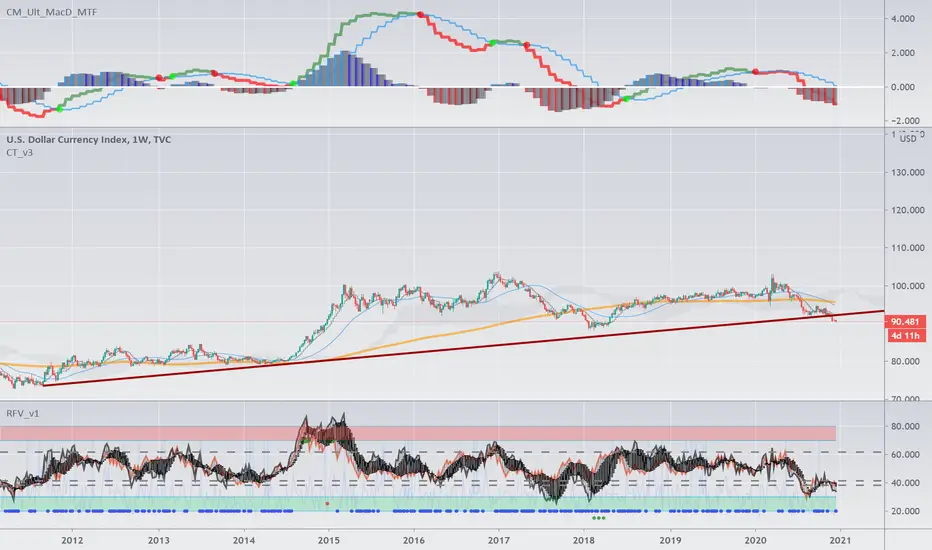
Relative Volatility vs Relative Strength
發行說明
Added tie in to Put to Call Ratio for Signal generation.The P:C signals are designed for broad market bullish bias.
Small green dots on the bottom indicate oversold with a low RSI.
Small blue dots on the bottom indicate a neutral market state.
Small red dots on the bottom indicate a medium-high to high RSI with an excessively bullish option outlook.
These added indications, if your ticker is correlated to the broader market should assist in noting bottoms on the hourly chart with green dots.
Small red dots should assist with profit taking and not be used to short the market, the general pattern should be buy during green, lighten to runners during blue and take profit on the rest of the runner if red shows up.
發行說明
Functionality Update- Relative Strength (RSI) - Black Line
- Relative Volatility (RVI) - Orange Line
- Intra-trend levels added - 38.2, 41.4, 61.8
- Candle Body - Defined OHLC (RSI simple moving average, RSI, RVI, RVI simple moving average)
Since volatility is relative to trend when trending bullishly volatility is to the downside. Conversely, volatility is to the upside when trending bearishly. RVI uses RSI's trend to determine which activity direction is considered volatility.
RVI rests on the counter-trend side of RSI. Its return inside of the candle body signifies a possible trend continuation. RSI similarly is considered to be breaking out once it leaves the candle body, and the trend weakening when inside.
The intra-trend levels are to help increase the useful resolution of the RSI chart. In a typically bullish trend, RSI will often dip into the 38.2-41.4 area and set a higher low. In a typically bearish trend, tops will often run out of steam near 61.8 rather than going all the way to 80+ overbought.
The candle body is actually just 7 SMAs of RSI and RVI but to help differentiate their purpose they are displayed this way so that RSI being inside of the SMAs indicates that the market in the short term is basically balanced or balancing, and being outside of them is a state of excess; essentially just saying that the market is moving. I use this in combination with Ichimoku's equilibrium concept so that RSI returning inside of the candle can help in the determination that a retrace in the middle of a trend move is a return to a 'relative fair value' and bounce back out signifys a continuation.
開源腳本
本著TradingView的真正精神,此腳本的創建者將其開源,以便交易者可以查看和驗證其功能。向作者致敬!雖然您可以免費使用它,但請記住,重新發佈程式碼必須遵守我們的網站規則。
免責聲明
這些資訊和出版物並不意味著也不構成TradingView提供或認可的金融、投資、交易或其他類型的意見或建議。請在使用條款閱讀更多資訊。
開源腳本
本著TradingView的真正精神,此腳本的創建者將其開源,以便交易者可以查看和驗證其功能。向作者致敬!雖然您可以免費使用它,但請記住,重新發佈程式碼必須遵守我們的網站規則。
免責聲明
這些資訊和出版物並不意味著也不構成TradingView提供或認可的金融、投資、交易或其他類型的意見或建議。請在使用條款閱讀更多資訊。