OPEN-SOURCE SCRIPT
已更新 Highest-Lowest Trend
𝙃𝙄𝙂𝙃𝙀𝙎𝙏-𝙇𝙊𝙒𝙀𝙎𝙏 𝙏𝙍𝙀𝙉𝘿 𝙄𝙉𝘿𝙄𝘾𝘼𝙏𝙊𝙍
Overview:
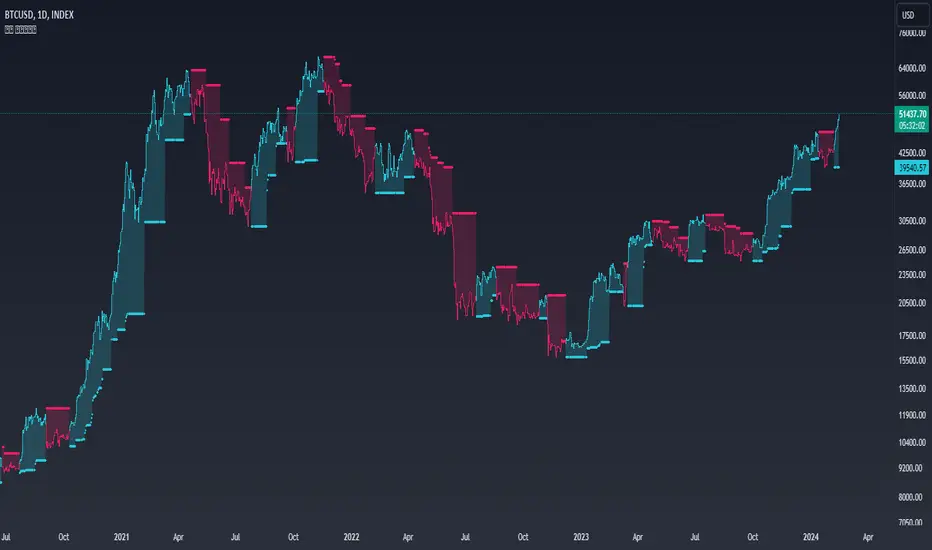
The "Highest-Lowest Trend" indicator helps traders identify trends based on the highest and lowest values within a specified period. It provides visual cues to understand potential trend changes, making it a valuable tool for technical analysis.
Settings:
Visual Settings:
Indicator Calculation:
The indicator calculates the highest and lowest values within the defined length and offset.
The current trend is determined based on whether the closing price is above or below these values.
When the source crossed above highest indicator changes trend to upside and start to use lowest value and vice versa.
Pine Script®
Usage:
Note:
Trading involves inherent risks, and it is essential to exercise caution and employ multiple tools and indicators for comprehensive analysis. While the "Highest-Lowest Trend" indicator provides valuable insights into potential trend changes, relying solely on one tool for trading decisions is not recommended. Market conditions can be dynamic, and using a combination of indicators can enhance your overall analysis, providing a more robust foundation for decision-making. Always consider the broader market context, risk management strategies, and other relevant factors before executing trades.
Overview:
The "Highest-Lowest Trend" indicator helps traders identify trends based on the highest and lowest values within a specified period. It provides visual cues to understand potential trend changes, making it a valuable tool for technical analysis.
Settings:
- Length and Offset: Adjust the length and offset parameters to customize the sensitivity of the indicator.
- Source: Determines whether to use the high and low prices or the closing price and others for calculations.
Visual Settings:
- Bar Color: Enables or disables the coloring of bars based on the trend direction.
- Up Color: Specifies the color for upward trends.
- Down Color: Specifies the color for downward trends.
Indicator Calculation:
The indicator calculates the highest and lowest values within the defined length and offset.
The current trend is determined based on whether the closing price is above or below these values.
When the source crossed above highest indicator changes trend to upside and start to use lowest value and vice versa.
/// 𝙄𝙉𝘿𝙄𝘾𝘼𝙏𝙊𝙍 𝘾𝘼𝙇𝘾𝙐𝙇𝘼𝙏𝙄𝙊𝙉 ///
var series float hlt = 0.0
series float upper = ta.highest(Use_High_and_Low ? high : src, length)[offset]
series float lower = ta.lowest( Use_High_and_Low ? high : src, length)[offset]
hlt := src > upper ?
lower : src < lower ?
upper : nz(hlt)
Usage:
- Trend Identification: Watch for price to be above Trend Indicator crosses for up trend and below for down trend.
- Length and Offset: Adjust the length and offset parameters to customize the sensitivity of the indicator.
- Color, color bars: Change color of trends and bars for your taste
Note:
Trading involves inherent risks, and it is essential to exercise caution and employ multiple tools and indicators for comprehensive analysis. While the "Highest-Lowest Trend" indicator provides valuable insights into potential trend changes, relying solely on one tool for trading decisions is not recommended. Market conditions can be dynamic, and using a combination of indicators can enhance your overall analysis, providing a more robust foundation for decision-making. Always consider the broader market context, risk management strategies, and other relevant factors before executing trades.
發行說明
fixed line 24開源腳本
秉持TradingView一貫精神,這個腳本的創作者將其設為開源,以便交易者檢視並驗證其功能。向作者致敬!您可以免費使用此腳本,但請注意,重新發佈代碼需遵守我們的社群規範。
免責聲明
這些資訊和出版物並非旨在提供,也不構成TradingView提供或認可的任何形式的財務、投資、交易或其他類型的建議或推薦。請閱讀使用條款以了解更多資訊。
開源腳本
秉持TradingView一貫精神,這個腳本的創作者將其設為開源,以便交易者檢視並驗證其功能。向作者致敬!您可以免費使用此腳本,但請注意,重新發佈代碼需遵守我們的社群規範。
免責聲明
這些資訊和出版物並非旨在提供,也不構成TradingView提供或認可的任何形式的財務、投資、交易或其他類型的建議或推薦。請閱讀使用條款以了解更多資訊。