PROTECTED SOURCE SCRIPT
Simple Breakout Zones MTF
Simple Breakout Zones MTF
Overview
The "Simple Breakout Zones MTF" indicator is designed to help traders identify key breakout and rejection zones using multi-timeframe (MTF) analysis. By calculating high and low zones based on both close and high/low data, this indicator provides a comprehensive view of market movements. It is ideal for traders looking to spot potential trend reversals, breakouts, or rejections with added flexibility through MTF support and customizable tolerance modes.
Key Features
Multi-Timeframe (MTF) Support: Analyze data from different timeframes for both Close Mode and HL (High/Low) Mode to gain a broader market perspective.
Tolerance Modes: Choose from three tolerance options—ATR, Percent, or Fixed—to adjust the sensitivity of breakout and rejection signals.
Zone Visualization: Easily identify high and low zones with filled areas, making it simple to spot potential breakout or rejection levels.
Breakout and Rejection Detection: Detects breakouts and rejections for both Close and HL modes, with specific conditions to ensure accurate signals.
Custom Alerts: Set up alerts for various scenarios, including when both modes agree on a breakout or rejection, or when only one mode triggers a signal.
Multi-Timeframe (MTF) and Higher Timeframe (HTF) Utility
The Multi-Timeframe (MTF) and Higher Timeframe (HTF) modes are powerful features that significantly enhance the indicator’s versatility and effectiveness. By enabling MTF/HTF analysis, traders can integrate data from multiple timeframes—such as daily, weekly, or monthly—into a single chart, regardless of the timeframe they are currently viewing. This capability is invaluable for understanding the bigger picture of market behavior. For instance, a trader working on a 15-minute chart can leverage HTF data from a daily chart to identify overarching trends, critical support and resistance levels, or potential reversal zones that would otherwise remain hidden on shorter timeframes. This multi-layered perspective is especially beneficial for swing traders, position traders, or anyone employing strategies that require alignment with longer-term market movements.
Additionally, the MTF/HTF functionality allows traders to filter out noise and false signals often present in lower timeframes. For example, a breakout signal on a 1-hour chart gains greater significance when confirmed by HTF analysis showing a similar breakout on a 4-hour or daily timeframe. This confluence increases confidence in trade setups and reduces the likelihood of acting on fleeting market fluctuations. Whether used to spot macro trends, validate trade entries, or time exits with precision, the MTF/HTF modes make this indicator a robust tool for adapting to various trading styles and market conditions.
Non-Repainting Indicator
A standout advantage of this indicator is its non-repainting nature, which applies fully to the MTF and HTF modes. Unlike repainting indicators that retroactively alter their signals, this indicator locks in its calculated levels and zones once a bar closes on the chosen timeframe—whether it’s the current chart’s timeframe or a higher one selected via MTF/HTF settings. This reliability is critical for traders who depend on consistent historical data for strategy development and backtesting. For example, a support zone identified on a daily timeframe using HTF mode will remain unchanged in the past, present, and future, ensuring that what you see in a backtest mirrors what you would have experienced in real-time trading. This non-repainting feature fosters trust in the indicator’s signals, making it a dependable choice for both discretionary and systematic traders seeking accurate, reproducible results.
How It Works
The indicator calculates the highest and lowest values over a specified period (length) for both close prices (Close Mode) and high/low prices (HL Mode). These calculations can be performed on the current timeframe or a higher timeframe using MTF settings. The high and low zones are created by taking the maximum and minimum of the Close and HL levels, respectively.
Breakouts: A breakout occurs when the price closes beyond the calculated levels for both modes or just one, depending on the alert condition.
Rejections: A rejection is detected when the price touches the zone but fails to close beyond it, indicating potential resistance or support.
Tolerance is applied to the rejection logic to account for minor price fluctuations and can be customized using ATR, a percentage of the price, or a fixed value.
Usage Instructions
1. Input Settings
Use MTF for Close Mode?: Enable this option to analyze Close Mode data from a higher timeframe. When enabled, the indicator will use the specified 'Close Mode Timeframe' for calculations.
Close Mode Timeframe: Select the timeframe for Close Mode analysis (e.g., 'D' for daily). This allows you to incorporate longer-term close price data into your analysis.
Use MTF for HL Mode?: Enable this option to analyze HL (High/Low) Mode data from a higher timeframe. When enabled, the indicator will use the specified 'HL Mode Timeframe' for calculations.
HL Mode Timeframe: Select the timeframe for HL Mode analysis. This enables you to consider longer-term high and low price levels.
Source: Choose the data source for calculations (default is 'close').
Length: Set the lookback period for calculating the highest and lowest values.
Tolerance Mode: Select how tolerance is calculated—'ATR', 'Percent', or 'Fixed'.
ATR Length: Set the ATR period if using ATR tolerance.
ATR Multiplier: Adjust the multiplier for ATR-based tolerance.
Tolerance % of Price: Set the percentage for Percent tolerance.
Fixed Tolerance (Points): Set a fixed tolerance value in points.
2. Visual Elements
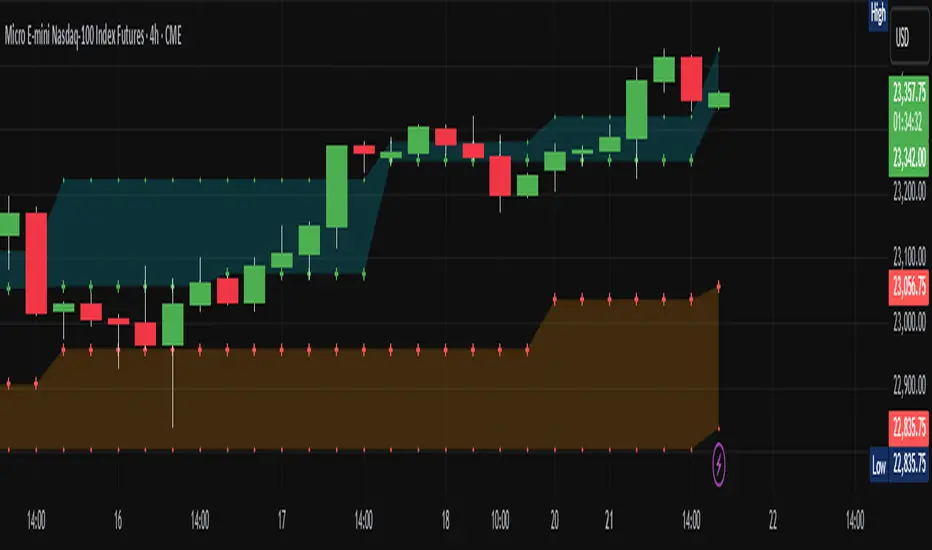
High Zone: A filled area (aqua) between the highest levels of Close Max and HL Max.
Low Zone: A filled area (orange) between the lowest levels of Close Min and HL Min.
Close Max/Min: Green and red crosses indicating the highest and lowest close prices over the specified length.
HL Max/Min: Green and red crosses indicating the highest high and lowest low prices over the specified length.
3. Alerts
The indicator provides several alert conditions to notify you of potential trading opportunities:
Both Modes New High: Triggers when both Close and HL modes agree on a new high, indicating a strong breakout signal upward.
Both Modes New Low: Triggers when both modes agree on a new low, indicating a strong breakout signal downward.
Both Modes Rejection: Triggers when both modes agree on a rejection, suggesting strong resistance or support.
Close Mode New High: Triggers when only Close Mode indicates a new high, useful for early breakout signals upward.
Close Mode New Low: Triggers when only Close Mode indicates a new low, useful for early breakout signals downward.
Weak Rejection Up: Triggers when only one mode indicates a rejection upward, signaling a weaker but noteworthy resistance.
Weak Rejection Down: Triggers when only one mode indicates a rejection downward, signaling a weaker but noteworthy support.
Why Use This Indicator?
Enhanced Market Insight: Combining data from multiple timeframes and modes provides a more complete picture of market dynamics.
Customizable Sensitivity: Adjust tolerance settings to fine-tune the indicator for different market conditions or trading styles.
Clear Visual Cues: Filled zones and plotted levels make it easy to spot key areas of interest on the chart.
Versatile Alerts: Tailor alerts to capture both strong and subtle market movements, ensuring you never miss a potential opportunity.
Reliable Signals: The non-repainting nature of the indicator ensures that the signals and zones are consistent and trustworthy, both in backtesting and live trading.
Overview
The "Simple Breakout Zones MTF" indicator is designed to help traders identify key breakout and rejection zones using multi-timeframe (MTF) analysis. By calculating high and low zones based on both close and high/low data, this indicator provides a comprehensive view of market movements. It is ideal for traders looking to spot potential trend reversals, breakouts, or rejections with added flexibility through MTF support and customizable tolerance modes.
Key Features
Multi-Timeframe (MTF) Support: Analyze data from different timeframes for both Close Mode and HL (High/Low) Mode to gain a broader market perspective.
Tolerance Modes: Choose from three tolerance options—ATR, Percent, or Fixed—to adjust the sensitivity of breakout and rejection signals.
Zone Visualization: Easily identify high and low zones with filled areas, making it simple to spot potential breakout or rejection levels.
Breakout and Rejection Detection: Detects breakouts and rejections for both Close and HL modes, with specific conditions to ensure accurate signals.
Custom Alerts: Set up alerts for various scenarios, including when both modes agree on a breakout or rejection, or when only one mode triggers a signal.
Multi-Timeframe (MTF) and Higher Timeframe (HTF) Utility
The Multi-Timeframe (MTF) and Higher Timeframe (HTF) modes are powerful features that significantly enhance the indicator’s versatility and effectiveness. By enabling MTF/HTF analysis, traders can integrate data from multiple timeframes—such as daily, weekly, or monthly—into a single chart, regardless of the timeframe they are currently viewing. This capability is invaluable for understanding the bigger picture of market behavior. For instance, a trader working on a 15-minute chart can leverage HTF data from a daily chart to identify overarching trends, critical support and resistance levels, or potential reversal zones that would otherwise remain hidden on shorter timeframes. This multi-layered perspective is especially beneficial for swing traders, position traders, or anyone employing strategies that require alignment with longer-term market movements.
Additionally, the MTF/HTF functionality allows traders to filter out noise and false signals often present in lower timeframes. For example, a breakout signal on a 1-hour chart gains greater significance when confirmed by HTF analysis showing a similar breakout on a 4-hour or daily timeframe. This confluence increases confidence in trade setups and reduces the likelihood of acting on fleeting market fluctuations. Whether used to spot macro trends, validate trade entries, or time exits with precision, the MTF/HTF modes make this indicator a robust tool for adapting to various trading styles and market conditions.
Non-Repainting Indicator
A standout advantage of this indicator is its non-repainting nature, which applies fully to the MTF and HTF modes. Unlike repainting indicators that retroactively alter their signals, this indicator locks in its calculated levels and zones once a bar closes on the chosen timeframe—whether it’s the current chart’s timeframe or a higher one selected via MTF/HTF settings. This reliability is critical for traders who depend on consistent historical data for strategy development and backtesting. For example, a support zone identified on a daily timeframe using HTF mode will remain unchanged in the past, present, and future, ensuring that what you see in a backtest mirrors what you would have experienced in real-time trading. This non-repainting feature fosters trust in the indicator’s signals, making it a dependable choice for both discretionary and systematic traders seeking accurate, reproducible results.
How It Works
The indicator calculates the highest and lowest values over a specified period (length) for both close prices (Close Mode) and high/low prices (HL Mode). These calculations can be performed on the current timeframe or a higher timeframe using MTF settings. The high and low zones are created by taking the maximum and minimum of the Close and HL levels, respectively.
Breakouts: A breakout occurs when the price closes beyond the calculated levels for both modes or just one, depending on the alert condition.
Rejections: A rejection is detected when the price touches the zone but fails to close beyond it, indicating potential resistance or support.
Tolerance is applied to the rejection logic to account for minor price fluctuations and can be customized using ATR, a percentage of the price, or a fixed value.
Usage Instructions
1. Input Settings
Use MTF for Close Mode?: Enable this option to analyze Close Mode data from a higher timeframe. When enabled, the indicator will use the specified 'Close Mode Timeframe' for calculations.
Close Mode Timeframe: Select the timeframe for Close Mode analysis (e.g., 'D' for daily). This allows you to incorporate longer-term close price data into your analysis.
Use MTF for HL Mode?: Enable this option to analyze HL (High/Low) Mode data from a higher timeframe. When enabled, the indicator will use the specified 'HL Mode Timeframe' for calculations.
HL Mode Timeframe: Select the timeframe for HL Mode analysis. This enables you to consider longer-term high and low price levels.
Source: Choose the data source for calculations (default is 'close').
Length: Set the lookback period for calculating the highest and lowest values.
Tolerance Mode: Select how tolerance is calculated—'ATR', 'Percent', or 'Fixed'.
ATR Length: Set the ATR period if using ATR tolerance.
ATR Multiplier: Adjust the multiplier for ATR-based tolerance.
Tolerance % of Price: Set the percentage for Percent tolerance.
Fixed Tolerance (Points): Set a fixed tolerance value in points.
2. Visual Elements
High Zone: A filled area (aqua) between the highest levels of Close Max and HL Max.
Low Zone: A filled area (orange) between the lowest levels of Close Min and HL Min.
Close Max/Min: Green and red crosses indicating the highest and lowest close prices over the specified length.
HL Max/Min: Green and red crosses indicating the highest high and lowest low prices over the specified length.
3. Alerts
The indicator provides several alert conditions to notify you of potential trading opportunities:
Both Modes New High: Triggers when both Close and HL modes agree on a new high, indicating a strong breakout signal upward.
Both Modes New Low: Triggers when both modes agree on a new low, indicating a strong breakout signal downward.
Both Modes Rejection: Triggers when both modes agree on a rejection, suggesting strong resistance or support.
Close Mode New High: Triggers when only Close Mode indicates a new high, useful for early breakout signals upward.
Close Mode New Low: Triggers when only Close Mode indicates a new low, useful for early breakout signals downward.
Weak Rejection Up: Triggers when only one mode indicates a rejection upward, signaling a weaker but noteworthy resistance.
Weak Rejection Down: Triggers when only one mode indicates a rejection downward, signaling a weaker but noteworthy support.
Why Use This Indicator?
Enhanced Market Insight: Combining data from multiple timeframes and modes provides a more complete picture of market dynamics.
Customizable Sensitivity: Adjust tolerance settings to fine-tune the indicator for different market conditions or trading styles.
Clear Visual Cues: Filled zones and plotted levels make it easy to spot key areas of interest on the chart.
Versatile Alerts: Tailor alerts to capture both strong and subtle market movements, ensuring you never miss a potential opportunity.
Reliable Signals: The non-repainting nature of the indicator ensures that the signals and zones are consistent and trustworthy, both in backtesting and live trading.
受保護腳本
此腳本以閉源形式發佈。 不過,您可以自由使用,沒有任何限制 — 點擊此處了解更多。
免責聲明
這些資訊和出版物並非旨在提供,也不構成TradingView提供或認可的任何形式的財務、投資、交易或其他類型的建議或推薦。請閱讀使用條款以了解更多資訊。
受保護腳本
此腳本以閉源形式發佈。 不過,您可以自由使用,沒有任何限制 — 點擊此處了解更多。
免責聲明
這些資訊和出版物並非旨在提供,也不構成TradingView提供或認可的任何形式的財務、投資、交易或其他類型的建議或推薦。請閱讀使用條款以了解更多資訊。