PROTECTED SOURCE SCRIPT
已更新 Boxes & Lines
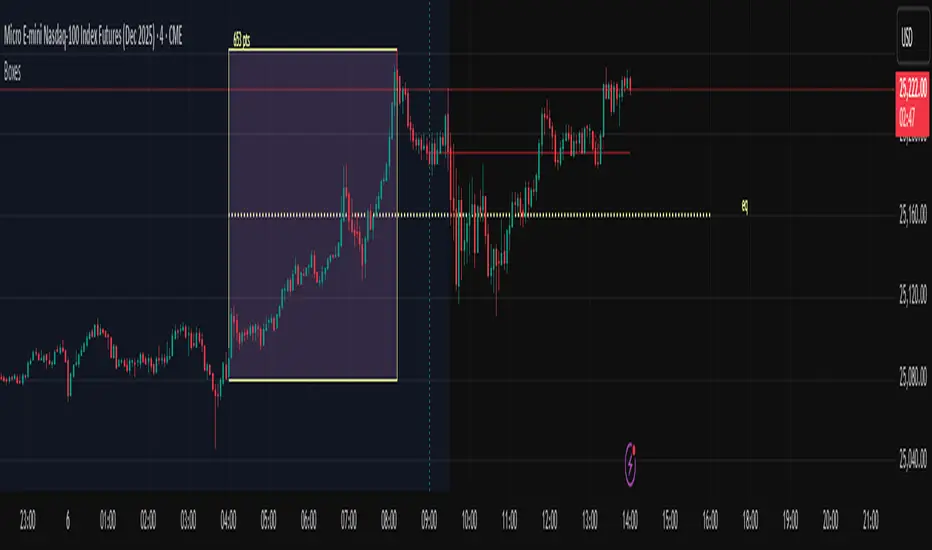
### Boxes & Lines Indicator
This indicator overlays horizontal lines, vertical lines, and boxes on the chart to highlight user-defined sessions, opening prices, and specific times. It supports up to 10 customizable instances each for opening prices, time markers, and session ranges. The source code is protected to preserve the implementation details, but the functionality is designed to provide flexible visual aids for intraday analysis on timeframe.isintraday charts.
#### Purpose
The script allows traders to mark key intraday periods with visual elements such as price lines from session opens, dotted vertical lines at specific times, and boxed ranges with optional projections, mid-levels, equilibrium lines, and point counts. It uses a selected timezone to align elements accurately across different symbols.
#### How It Works
- **Custom Opening Prices (COP)**: Draws horizontal lines at the opening price of specified sessions, extending to the session end or a custom point. Each can be enabled individually with a session time and color.
- **Custom Times (CT)**: Places dotted vertical lines at user-defined times, extending across the chart height. Supports up to 10 with unique colors.
- **Custom Sessions (CS)**: Creates boxes for session ranges, updating dynamically with high/low extremes. Options include:
- Background and border colors with adjustable border width.
- Projections: Extends levels beyond the box based on session range (e.g., full range or half for anchored modes).
- Mid-levels: Short horizontal lines at halfway points between projections.
- Equilibrium (EQ) Line: A dotted line at the session midpoint, optionally extended to a custom end time.
- Point Count: Labels the session range in points (using syminfo.mintick).
- Anchoring: Optionally bases projections on a separate anchor time's open instead of the session's range.
The script uses functions like request.security_lower_tf() for minute-level data and custom string handling for session parsing. It resets visuals at session starts and updates in real-time during active sessions.
#### How to Use
1. Add the indicator to your chart.
2. In the inputs:
- Select a **Timezone** from the dropdown (default: UTC-4) to match your market.
- For each **Custom Opening Price (1-10)**: Enable "Show Custom Opening Price X", set the session (e.g., '0900-1400'), and choose a color.
- For each **Custom Time (1-10)**: Enable "Mark Custom Time X with Vertical Line", set the time (e.g., '0900-0905'), and choose a color.
- For each **Custom Session (1-10)**: Enable "Plot Custom Session X", set the session time (e.g., '0900-1700'), and configure:
- Background and border colors, border size.
- Number of projections (default: 3).
- Toggles for projections, mid-levels, EQ line, point label, and EQ extension.
- Optional anchoring with a separate anchor time.
3. Apply changes; visuals appear on intraday timeframes during or after specified sessions.
This indicator is original and intended as a tool for visualizing time-based structures. It does not generate signals or provide trading advice. Test on historical data to understand behavior on your symbols. Updates may include release notes for any changes.
發行說明
fixed EQ受保護腳本
此腳本以閉源形式發佈。 不過,您可以自由且不受任何限制地使用它 — 在此處了解更多資訊。
Doer
免責聲明
這些資訊和出版物並不意味著也不構成TradingView提供或認可的金融、投資、交易或其他類型的意見或建議。請在使用條款閱讀更多資訊。
受保護腳本
此腳本以閉源形式發佈。 不過,您可以自由且不受任何限制地使用它 — 在此處了解更多資訊。
免責聲明
這些資訊和出版物並不意味著也不構成TradingView提供或認可的金融、投資、交易或其他類型的意見或建議。請在使用條款閱讀更多資訊。