OPEN-SOURCE SCRIPT
已更新 Close Price Percentile
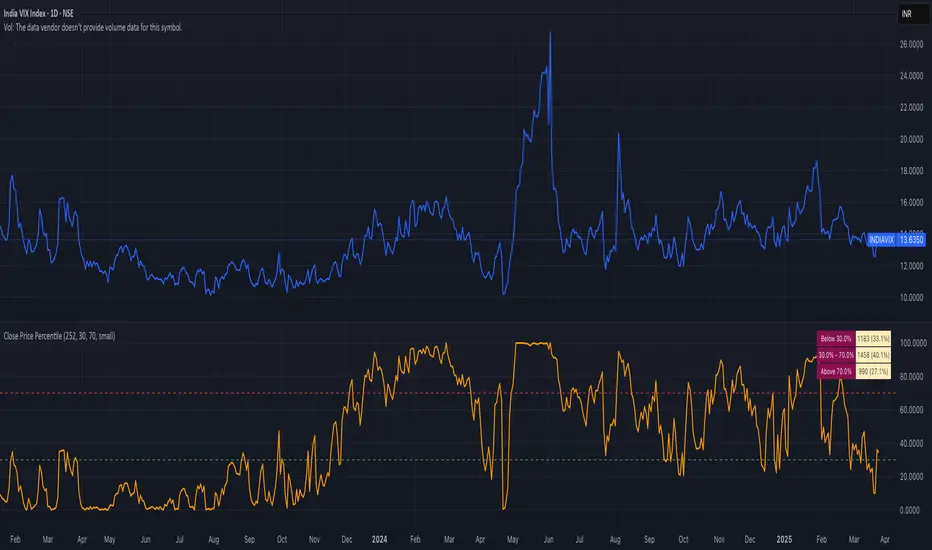
Close Price Percentile with Range Distribution
This indicator helps traders identify where the current price stands relative to its historical context using percentile ranking. It calculates and displays the current price's percentile position within a customizable lookback window (default: 365 periods).
Key Features:
• Percentile Ranking: Shows where the current price falls within its historical range (0-100%)
• Customizable Thresholds: Set your own high/low percentile boundaries for analysis
• Statistical Distribution: Tracks and displays the number and percentage of data points falling in each range (below threshold, between thresholds, above threshold)
• Visual References: Includes dashed lines at threshold levels for easy visual reference
• Clean Data Presentation: Organized table display in the top-right corner
Perfect for:
• Understanding price extremes
• Identifying potential overbought/oversold conditions
• Statistical analysis of price movements
• Mean reversion strategies
Fully customizable with adjustable window length, thresholds, and visual settings.
發行說明
Close Price Percentile with Range DistributionThis indicator helps traders identify where the current price stands relative to its historical context using percentile ranking. It calculates and displays the current price's percentile position within a customizable lookback window (default: 365 periods).
Key Features:
• Percentile Ranking: Shows where the current price falls within its historical range (0-100%)
• Customizable Thresholds: Set your own high/low percentile boundaries for analysis
• Statistical Distribution: Tracks and displays the number and percentage of data points falling in each range (below threshold, between thresholds, above threshold)
• Visual References: Includes dashed lines at threshold levels for easy visual reference
• Clean Data Presentation: Organized table display in the top-right corner
Perfect for:
• Understanding price extremes
• Identifying potential overbought/oversold conditions
• Statistical analysis of price movements
• Mean reversion strategies
Fully customizable with adjustable window length, thresholds, and visual settings.
開源腳本
秉持TradingView一貫精神,這個腳本的創作者將其設為開源,以便交易者檢視並驗證其功能。向作者致敬!您可以免費使用此腳本,但請注意,重新發佈代碼需遵守我們的社群規範。
免責聲明
這些資訊和出版物並非旨在提供,也不構成TradingView提供或認可的任何形式的財務、投資、交易或其他類型的建議或推薦。請閱讀使用條款以了解更多資訊。
免責聲明
這些資訊和出版物並非旨在提供,也不構成TradingView提供或認可的任何形式的財務、投資、交易或其他類型的建議或推薦。請閱讀使用條款以了解更多資訊。