OPEN-SOURCE SCRIPT
Trend-reversal
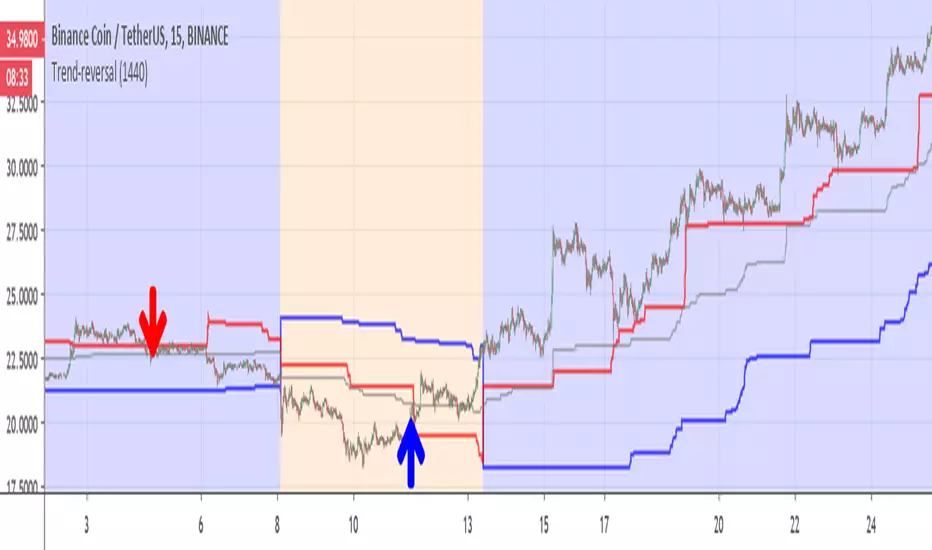
This indicator is for detection of trend reversal based on trailing stop (blue line)
the Bullish zone is in blue (red above blue line), bearish zone in orange ( blue line above red line)
gray line is the average of donchian channel
I put the line on 1440 min (so it like daily trailing line) , you can make it shorter if you want .
In this example of BNB coin we see in red arrow that the coin drop from red line so it loosing power -here it sell point during bullish period(blue)
on the other hand when we are in bearish (orange), we can see that the coin is breaking the red line -buy point and the trend is reverse
main script is taken from ceyhun so credit is to him on this
開源腳本
秉持TradingView一貫精神,這個腳本的創作者將其設為開源,以便交易者檢視並驗證其功能。向作者致敬!您可以免費使用此腳本,但請注意,重新發佈代碼需遵守我們的社群規範。
免責聲明
這些資訊和出版物並非旨在提供,也不構成TradingView提供或認可的任何形式的財務、投資、交易或其他類型的建議或推薦。請閱讀使用條款以了解更多資訊。
開源腳本
秉持TradingView一貫精神,這個腳本的創作者將其設為開源,以便交易者檢視並驗證其功能。向作者致敬!您可以免費使用此腳本,但請注意,重新發佈代碼需遵守我們的社群規範。
免責聲明
這些資訊和出版物並非旨在提供,也不構成TradingView提供或認可的任何形式的財務、投資、交易或其他類型的建議或推薦。請閱讀使用條款以了解更多資訊。