PROTECTED SOURCE SCRIPT
UniqueHorn - MA Indicator with SMI
📊 Overview
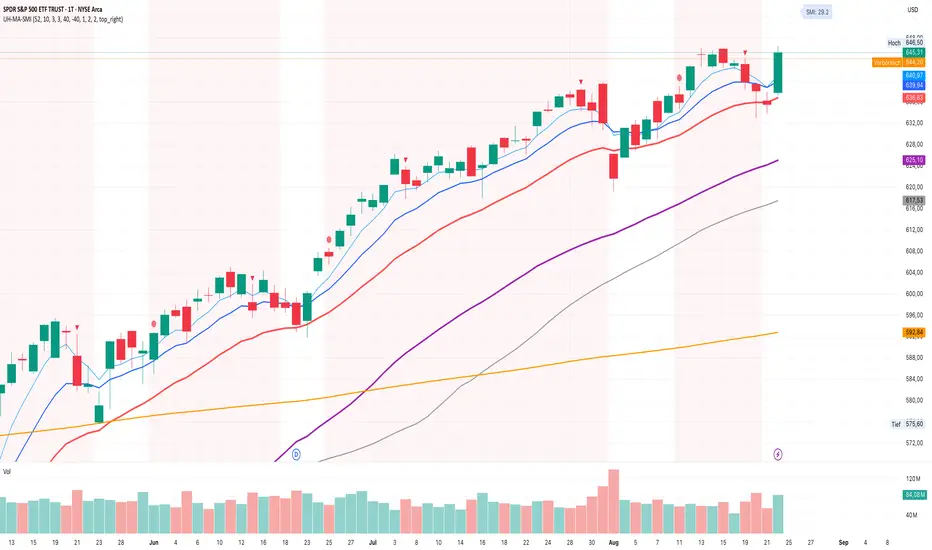
The UniqueHorn MA-SMI Indicator is a comprehensive trading tool that combines multiple Moving Averages with the Stochastic Momentum Index (SMI) in a clean, organized display. Designed for traders who need clear visual analysis of trend, momentum, and potential reversal points.
✨ Key Features
Moving Averages (8 Total)
3 EMAs: 5, 10, 20 (for quick trend detection)
5 SMAs: 30, 40, 50, 65, 200 (for medium to long-term trends)
Smart Timeframe Adaptation
Daily & Lower: EMA 5, 10, 20 | SMA 50, 65, 200
Weekly Chart: EMA 10, 20 | SMA 30, 40, 50, 200
Automatic display optimization based on timeframe
SMI Integration (Stochastic Momentum Index)
Visual signals directly on main chart
Overbought/Oversold markers
Bullish/Bearish crossover signals
Optional background coloring for extreme zones
Current SMI value as label
Climax Detection
Buying Climax: New 52-week high with red candle (weakness signal)
Selling Climax: New 52-week low with green candle (strength signal)
Works optimally on weekly charts
📈 Usage & Strategies
Trend Following
Use MAs as dynamic support/resistance
EMA crossovers for entry/exit signals
SMA 200 as primary trend filter
Momentum Trading
SMI < -40: Oversold zone → Potential long opportunity
SMI > 40: Overbought zone → Potential short opportunity
SMI crossovers as early trend reversal signals
Climax Trading
Buying Climax: Warning of potential top formation
Selling Climax: Indication of potential bottom formation
⚙️ Customization Options
Individual color selection for each MA
Separate line widths for EMA 5, 10, and other MAs
Show/Hide individual components
Fully adjustable SMI parameters
Optional info table with status overview
Comprehensive alert system for all signals
🎯 Ideal For
Swing Traders: Use the combination of MAs and SMI for optimal entries/exits
Position Traders: Focus on longer-term MAs and weekly chart signals
Day Traders: Fast EMAs with SMI momentum for short-term setups
📝 Notes
Climax signals work exclusively on weekly charts
SMI signals are available in all timeframes
Timeframe-specific MA display reduces visual clutter
Combine multiple signals for higher probability trades
🔔 Alert Functions
The indicator provides alerts for:
Buying/Selling Climaxes
SMI Overbought/Oversold zones
SMI Bullish/Bearish crossovers
EMA crossovers
Price-SMA200 crossovers
Version: 1.0
Pine Script: v6
Author: UniqueHorn
This indicator is the result of careful development and optimization for professional trading. For questions or suggestions, please use the comments section.
受保護腳本
此腳本以閉源形式發佈。 不過,您可以自由使用,沒有任何限制 — 點擊此處了解更多。
免責聲明
這些資訊和出版物並非旨在提供,也不構成TradingView提供或認可的任何形式的財務、投資、交易或其他類型的建議或推薦。請閱讀使用條款以了解更多資訊。
免責聲明
這些資訊和出版物並非旨在提供,也不構成TradingView提供或認可的任何形式的財務、投資、交易或其他類型的建議或推薦。請閱讀使用條款以了解更多資訊。