OPEN-SOURCE SCRIPT
Market Cycles
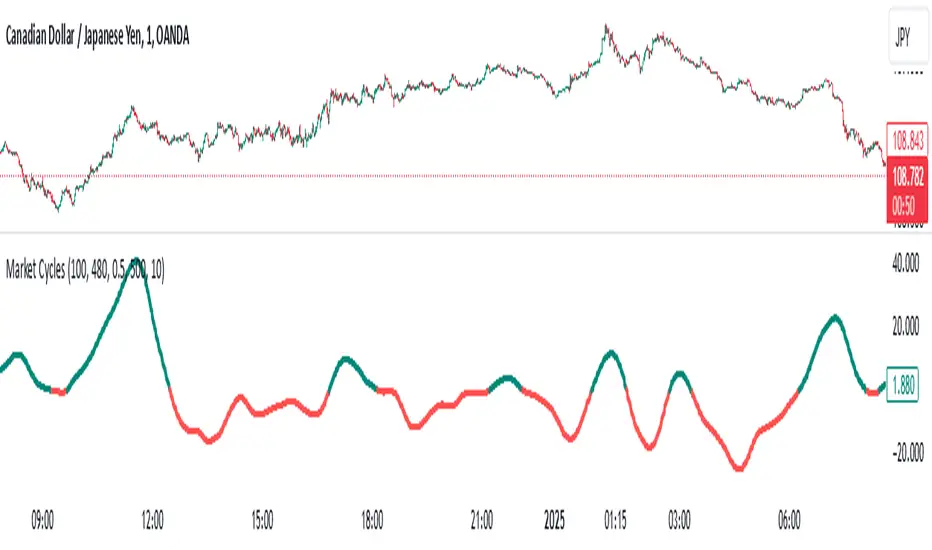
The Market Cycles indicator transforms market price data into a stochastic wave, offering a unique perspective on market cycles. The wave is bounded between positive and negative values, providing clear visual cues for potential bullish and bearish trends. When the wave turns green, it signals a bullish cycle, while red indicates a bearish cycle.
Designed to show clarity and precision, this tool helps identify market momentum and cyclical behavior in an intuitive way. Ideal for fine-tuning entries or analyzing broader trends, this indicator aims to enhance the decision-making process with simplicity and elegance.
開源腳本
秉持TradingView一貫精神,這個腳本的創作者將其設為開源,以便交易者檢視並驗證其功能。向作者致敬!您可以免費使用此腳本,但請注意,重新發佈代碼需遵守我們的社群規範。
免責聲明
這些資訊和出版物並非旨在提供,也不構成TradingView提供或認可的任何形式的財務、投資、交易或其他類型的建議或推薦。請閱讀使用條款以了解更多資訊。
開源腳本
秉持TradingView一貫精神,這個腳本的創作者將其設為開源,以便交易者檢視並驗證其功能。向作者致敬!您可以免費使用此腳本,但請注意,重新發佈代碼需遵守我們的社群規範。
免責聲明
這些資訊和出版物並非旨在提供,也不構成TradingView提供或認可的任何形式的財務、投資、交易或其他類型的建議或推薦。請閱讀使用條款以了解更多資訊。