OPEN-SOURCE SCRIPT
已更新 Wavechart v2
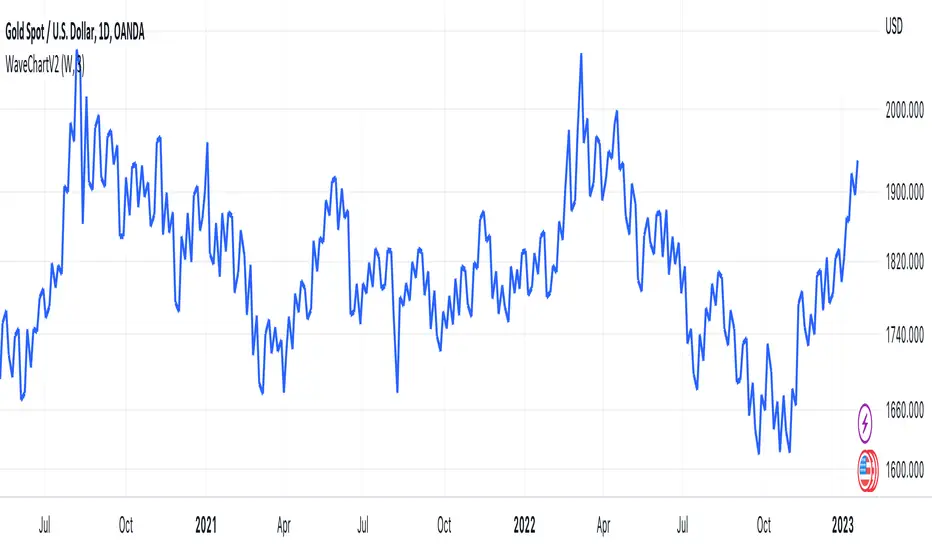
##Wave Chart v2##
For analyzing Neo-wave theory
Plot the market's highs and lows in real-time order.
Then connect the highs and lows
with a diagonal line. Next, the last plot of one day (or bar) is connected with a straight line to the
first plot of the next day (or bar).
For analyzing Neo-wave theory
Plot the market's highs and lows in real-time order.
Then connect the highs and lows
with a diagonal line. Next, the last plot of one day (or bar) is connected with a straight line to the
first plot of the next day (or bar).
發行說明
Chang name發行說明
- Add line width input - Add Force plot on the last bar
發行說明
Add Timeframe Day發行說明
In some cases, it may be uncertain whether the high or low value should come first, as both values are derived from the same candlestick. We currently assume it is based on the closing price of the candlestick.
However, there is an option in settings to display an unsure line.
To avoid ambiguity, it is recommended to use multiple timeframes for analysis.
發行說明
fix Force plot on the last bar發行說明
Add more Timeframe發行說明
fix period division發行說明
fix bug assume high low time based on closing price of the candlestick發行說明
Add Timeframe 240,60,30 發行說明
Add timeframe 2W and 2.5Y發行說明
fix 2.5year開源腳本
本著TradingView的真正精神,此腳本的創建者將其開源,以便交易者可以查看和驗證其功能。向作者致敬!雖然您可以免費使用它,但請記住,重新發佈程式碼必須遵守我們的網站規則。
免責聲明
這些資訊和出版物並不意味著也不構成TradingView提供或認可的金融、投資、交易或其他類型的意見或建議。請在使用條款閱讀更多資訊。
開源腳本
本著TradingView的真正精神,此腳本的創建者將其開源,以便交易者可以查看和驗證其功能。向作者致敬!雖然您可以免費使用它,但請記住,重新發佈程式碼必須遵守我們的網站規則。
免責聲明
這些資訊和出版物並不意味著也不構成TradingView提供或認可的金融、投資、交易或其他類型的意見或建議。請在使用條款閱讀更多資訊。