OPEN-SOURCE SCRIPT
RSI - colour fill
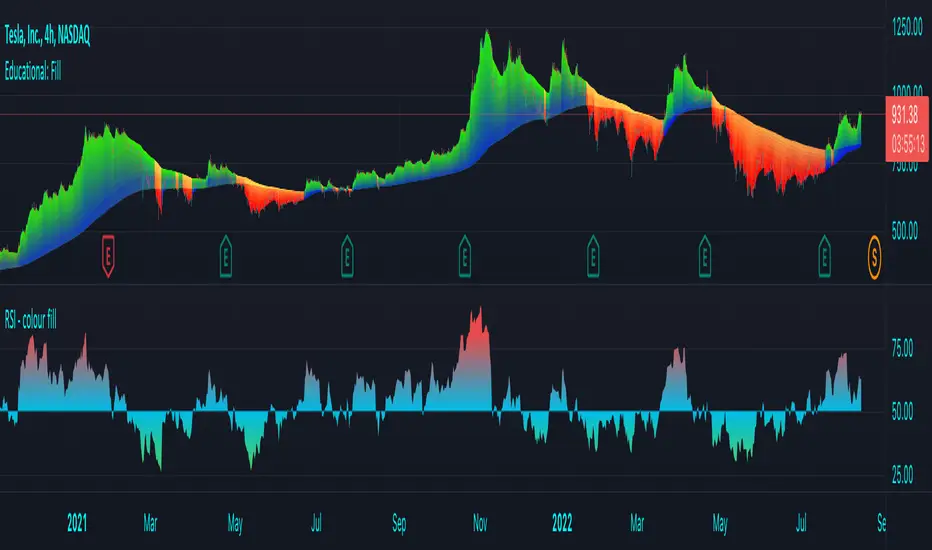
This script showcases the new (overload) feature regarding the fill() function! 🥳
2 plots could be filled before, but with just 1 colour per bar, now the colour can be a gradient type.
In this example we have 2 plots
- rsiPlot , which plots the rsi value
- centerPlot, which plots the value 50 ('centre line')
Explanation of colour fill in the zone 50-80
Default when rsi > 50
- a bottom value is set at 50 (associated with colour aqua)
- and a top value is set at 80 (associated with colour red)
This zone (bottom -> top value) is filled with a gradient colour (50 - aqua -> 80 - red)
When rsi is towards 80, you see a red coloured zone at the rsi value,
while when rsi is around 50, you'll only see the colour aqua
The same principle is applied in the zone 20-50 when rsi < 50
Cheers!
開源腳本
秉持TradingView一貫精神,這個腳本的創作者將其設為開源,以便交易者檢視並驗證其功能。向作者致敬!您可以免費使用此腳本,但請注意,重新發佈代碼需遵守我們的社群規範。
Who are PineCoders?
tradingview.com/chart/SSP/yW5eOqtm-Who-are-PineCoders/
TG Pine Script® Q&A: t.me/PineCodersQA
- We cannot control our emotions,
but we can control our keyboard -
tradingview.com/chart/SSP/yW5eOqtm-Who-are-PineCoders/
TG Pine Script® Q&A: t.me/PineCodersQA
- We cannot control our emotions,
but we can control our keyboard -
免責聲明
這些資訊和出版物並非旨在提供,也不構成TradingView提供或認可的任何形式的財務、投資、交易或其他類型的建議或推薦。請閱讀使用條款以了解更多資訊。