OPEN-SOURCE SCRIPT
RSI Overbought/Oversold MTF
RSI Overbought / Oversold MTF — Dashboard & Alerts
What it does
This script scans up to 13 symbols at once and shows their RSI readings on three lower‑time‑frames (1 min, 5 min, 15 min).
If all three RSIs for a symbol are simultaneously above the overbought threshold or below the oversold threshold, the script:
Prints the condition (“Overbought” / “Oversold”) in a color‑coded dashboard table.
Fires a one‑per‑bar alert so you never miss the move.
Key features
Feature Details
Multi‑symbol Default list includes BTC, ETH, SOL, BNB, XRP, ADA, AVAX, AVAAI, DOGE, VIRTUAL, SUI, ALCH, LAYER (all Binance pairs). Replace or reorder in the inputs.
Triple‑time‑frame check RSI is calculated on 1 m, 5 m, 15 m for each symbol.
Customizable thresholds Set your own RSI Period, Overbought and Oversold levels. Defaults: 14 / 70 / 30.
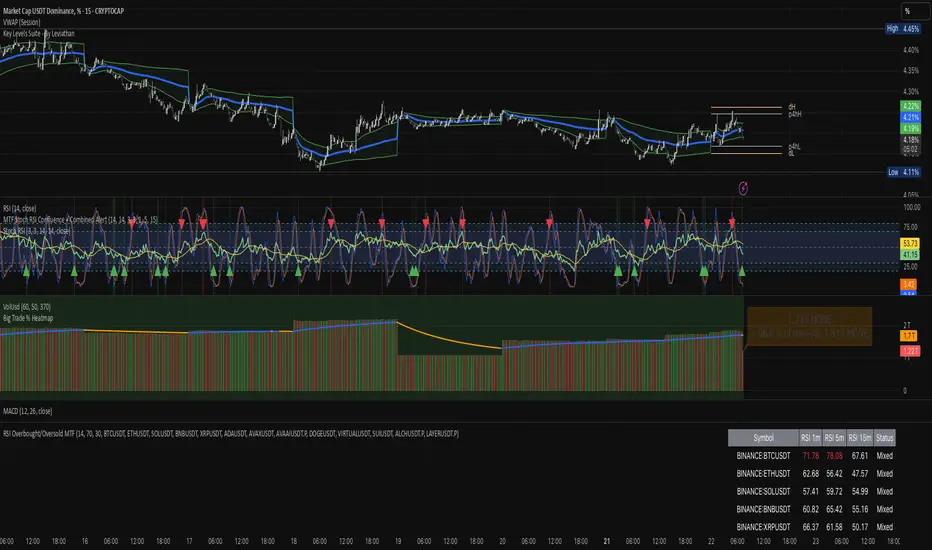
Color‑coded dashboard Top‑right table shows:
• Symbol name
• RSI 1 m / 5 m / 15 m (red = overbought, green = oversold, white = neutral)
• Overall Status column (“Overbought”, “Oversold”, “Mixed”).
Alerts built in Triggers once per bar whenever a symbol is overbought or oversold on all three time‑frames simultaneously.
Typical use cases
Scalp alignment — Enter when all short TFs agree on overbought/oversold extremes.
Mean‑reversion spotting — Identify stretched conditions across multiple coins without switching charts.
Quick sentiment scan — Glance at the dashboard to see where momentum is heating up or cooling down.
How to use
Add to chart (overlay = false; it sits in its own pane).
Adjust symbols & thresholds in the Settings panel.
Create alerts → choose “RSI Overbought/Oversold MTF” → “Any Alert() Function Call” to receive push, email, or webhook notifications.
Note: The script queries many symbols each bar; use on lower time‑frames only if your data limits allow.
For educational purposes only — not financial advice. Always test on paper before trading live.
What it does
This script scans up to 13 symbols at once and shows their RSI readings on three lower‑time‑frames (1 min, 5 min, 15 min).
If all three RSIs for a symbol are simultaneously above the overbought threshold or below the oversold threshold, the script:
Prints the condition (“Overbought” / “Oversold”) in a color‑coded dashboard table.
Fires a one‑per‑bar alert so you never miss the move.
Key features
Feature Details
Multi‑symbol Default list includes BTC, ETH, SOL, BNB, XRP, ADA, AVAX, AVAAI, DOGE, VIRTUAL, SUI, ALCH, LAYER (all Binance pairs). Replace or reorder in the inputs.
Triple‑time‑frame check RSI is calculated on 1 m, 5 m, 15 m for each symbol.
Customizable thresholds Set your own RSI Period, Overbought and Oversold levels. Defaults: 14 / 70 / 30.
Color‑coded dashboard Top‑right table shows:
• Symbol name
• RSI 1 m / 5 m / 15 m (red = overbought, green = oversold, white = neutral)
• Overall Status column (“Overbought”, “Oversold”, “Mixed”).
Alerts built in Triggers once per bar whenever a symbol is overbought or oversold on all three time‑frames simultaneously.
Typical use cases
Scalp alignment — Enter when all short TFs agree on overbought/oversold extremes.
Mean‑reversion spotting — Identify stretched conditions across multiple coins without switching charts.
Quick sentiment scan — Glance at the dashboard to see where momentum is heating up or cooling down.
How to use
Add to chart (overlay = false; it sits in its own pane).
Adjust symbols & thresholds in the Settings panel.
Create alerts → choose “RSI Overbought/Oversold MTF” → “Any Alert() Function Call” to receive push, email, or webhook notifications.
Note: The script queries many symbols each bar; use on lower time‑frames only if your data limits allow.
For educational purposes only — not financial advice. Always test on paper before trading live.
開源腳本
本著TradingView的真正精神,此腳本的創建者將其開源,以便交易者可以查看和驗證其功能。向作者致敬!雖然您可以免費使用它,但請記住,重新發佈程式碼必須遵守我們的網站規則。
免責聲明
這些資訊和出版物並不意味著也不構成TradingView提供或認可的金融、投資、交易或其他類型的意見或建議。請在使用條款閱讀更多資訊。
開源腳本
本著TradingView的真正精神,此腳本的創建者將其開源,以便交易者可以查看和驗證其功能。向作者致敬!雖然您可以免費使用它,但請記住,重新發佈程式碼必須遵守我們的網站規則。
免責聲明
這些資訊和出版物並不意味著也不構成TradingView提供或認可的金融、投資、交易或其他類型的意見或建議。請在使用條款閱讀更多資訊。