INVITE-ONLY SCRIPT
已更新 QuantPivote
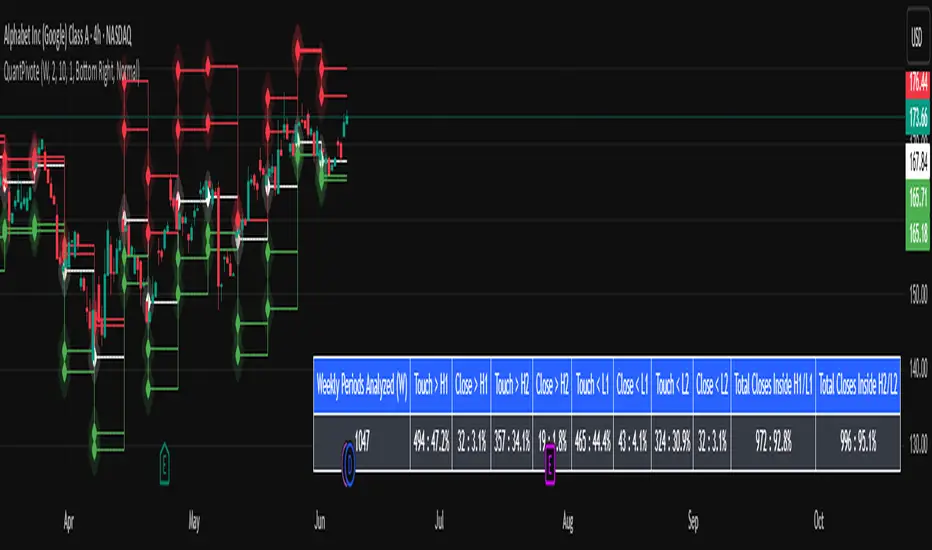
We are introducing the ST_QuantPivots Indicator, an advanced analytical tool meticulously crafted for ThinkOrSwim, which is now poised to debut on TradingView with Pine Script conversion.
Weekly Periods Analyzed :
Touch > H1 :
Close > H1 :
Touch > H2 :
Close > H2 :
Touch > L1 :
Close > L1 :
Touch > L2 :
Close > L2 :
Total Closes Inside H1 / L1 :
Total Closes Inside H2 / L2 :
Pivots :
Pivot lines are a function of the analysis and averaging period inputs.

Weekly Periods Analyzed :
- The number of total periods loaded and analyzed is on the chart.
Touch > H1 :
- Pivot level average price exceeded or was equal to, but did not close above.
Close > H1 :
- How often has the price closed above the H1 pivot level.
Touch > H2 :
- Pivot level one standard deviation above H1.
- The price exceeded or was equal to, but did not close above.
Close > H2 :
- How many times has the price closed above the H2 pivot level .
Touch > L1 :
- Pivot level average price exceeded or was equal to, but did not close below.
Close > L1 :
- How many times has the price closed below the L1 pivot level.
Touch > L2 :
- Pivot level one standard deviation below L1.
- The price exceeded or was equal to, but did not closed below.
Close > L2 :
- How many times has the price closed below the L2 pivot level.
Total Closes Inside H1 / L1 :
- Total number of times with in the periods analyzed that there were closes within H1 / L1 .
Total Closes Inside H2 / L2 :
- Total number of times with in the periods analyzed that there were closes within H2 / L2 respectively.
Pivots :
Pivot lines are a function of the analysis and averaging period inputs.
- H1 represents the average point which the highest price is achieved for the selected time period (analysis period).
- L1 represents the average point which the lowest price is achieved for the selected time period (analysis period).
- H2/L2 = One standard deviation away from the inner high H1 or low L1 bands.
發行說明
Updated to from pinescript v5 to pinescript v6僅限邀請腳本
僅作者批准的使用者才能訪問此腳本。您需要申請並獲得使用許可,通常需在付款後才能取得。更多詳情,請依照作者以下的指示操作,或直接聯絡pineaflAlgo。
TradingView不建議在未完全信任作者並了解其運作方式的情況下購買或使用腳本。您也可以在我們的社群腳本中找到免費的開源替代方案。
作者的說明
This is a paid indicator. Please contact the author for a week's trial access on Trading View chat or Message on telegram with the Tradingview username https://t.me/pineafl for new feature requests reach out to pramod@pineafl.com
PineaflAlgo
免責聲明
這些資訊和出版物並非旨在提供,也不構成TradingView提供或認可的任何形式的財務、投資、交易或其他類型的建議或推薦。請閱讀使用條款以了解更多資訊。
僅限邀請腳本
僅作者批准的使用者才能訪問此腳本。您需要申請並獲得使用許可,通常需在付款後才能取得。更多詳情,請依照作者以下的指示操作,或直接聯絡pineaflAlgo。
TradingView不建議在未完全信任作者並了解其運作方式的情況下購買或使用腳本。您也可以在我們的社群腳本中找到免費的開源替代方案。
作者的說明
This is a paid indicator. Please contact the author for a week's trial access on Trading View chat or Message on telegram with the Tradingview username https://t.me/pineafl for new feature requests reach out to pramod@pineafl.com
PineaflAlgo
免責聲明
這些資訊和出版物並非旨在提供,也不構成TradingView提供或認可的任何形式的財務、投資、交易或其他類型的建議或推薦。請閱讀使用條款以了解更多資訊。