PROTECTED SOURCE SCRIPT
Hammer Candle Finder [MQSXN]
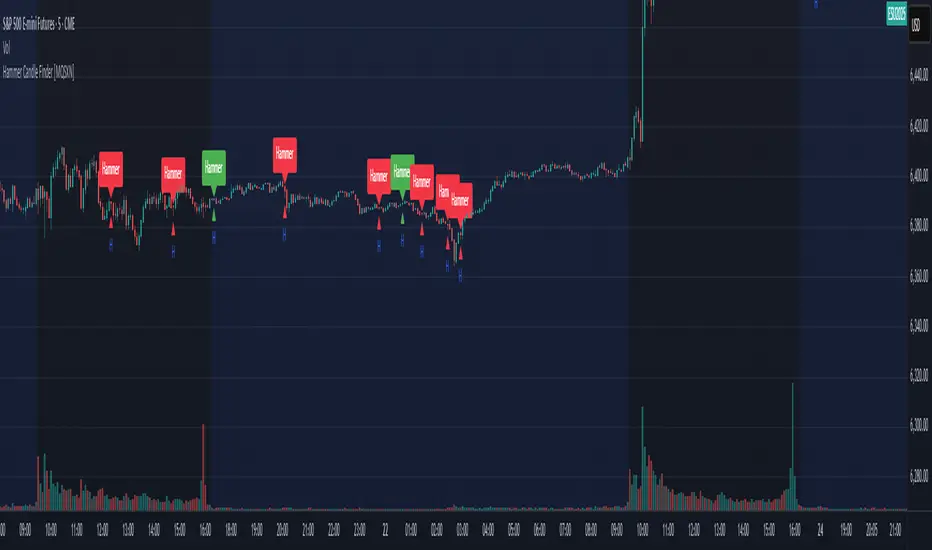
This script automatically scans your chart for hammer candlestick patterns and highlights them with fully customizable labels and markers. Hammers are classic price action signals that can suggest potential reversals or exhaustion in the current trend.
How it works:
- Detects candles with a small body near the top of the range, a long lower wick, and minimal upper wick.
- Separates bullish hammers (green close above open) from bearish hammers (red close below open).
- You can choose to display either type—or both—depending on your trading style.
Customizable options:
- Adjustable detection sensitivity (body % of range, wick-to-body ratio, top wick allowance).
- Toggle to show/hide bullish or bearish signals.
- Custom text, colors, label style, and positioning for the markers.
- Option to anchor labels above bars automatically or offset them by a set number of ticks.
Usage:
This tool is designed for traders who want a clear, visual way to spot hammer candles in real time or during historical chart analysis. Combine it with your own support/resistance zones, volume analysis, or confirmation indicators to build complete strategies.
Note:
This indicator does not provide buy/sell signals on its own—it’s meant to assist with candlestick recognition. Always confirm with your broader trading plan and risk management rules.
受保護腳本
此腳本以閉源形式發佈。 不過,您可以自由使用,沒有任何限制 — 點擊此處了解更多。
免責聲明
這些資訊和出版物並非旨在提供,也不構成TradingView提供或認可的任何形式的財務、投資、交易或其他類型的建議或推薦。請閱讀使用條款以了解更多資訊。
免責聲明
這些資訊和出版物並非旨在提供,也不構成TradingView提供或認可的任何形式的財務、投資、交易或其他類型的建議或推薦。請閱讀使用條款以了解更多資訊。