OPEN-SOURCE SCRIPT
Combined OP Lines and Daily High/Low
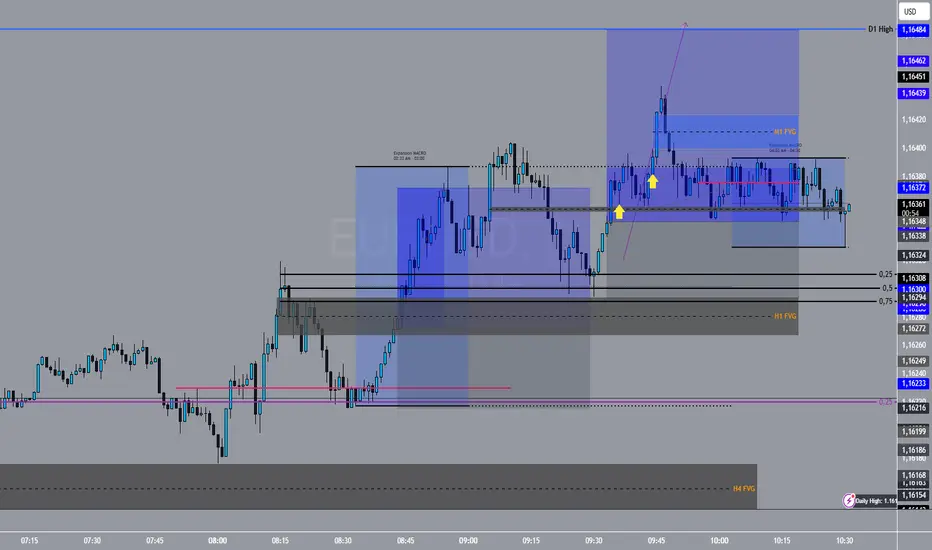
This Pine Script v6 indicator for TradingView ("Combined OP Lines and Daily High/Low") overlays the chart and visualizes in UTC+02:00 (manually adjust for DST):
OP Lines: At 0:00 (new day) and 6:00 AM, draws black horizontal lines at the opening price (extend right), vertical black markers, and labels ("OP 0:00"/"OP 6:00"). Old elements are deleted.
Previous Day High/Low: Blue thick horizontal lines (extend right) with labels ("Daily High/Low: [Price]"), based on request.security (daily TF, high/low[1]).
Useful for day trading: Marks intraday sessions and prior-day extremes as support/resistance. Purely visual, dynamically updated, efficient (resource management). Limitations: Fixed timezone, no alerts, colors could be optimized.
開源腳本
本著TradingView的真正精神,此腳本的創建者將其開源,以便交易者可以查看和驗證其功能。向作者致敬!雖然您可以免費使用它,但請記住,重新發佈程式碼必須遵守我們的網站規則。
免責聲明
這些資訊和出版物並不意味著也不構成TradingView提供或認可的金融、投資、交易或其他類型的意見或建議。請在使用條款閱讀更多資訊。
開源腳本
本著TradingView的真正精神,此腳本的創建者將其開源,以便交易者可以查看和驗證其功能。向作者致敬!雖然您可以免費使用它,但請記住,重新發佈程式碼必須遵守我們的網站規則。
免責聲明
這些資訊和出版物並不意味著也不構成TradingView提供或認可的金融、投資、交易或其他類型的意見或建議。請在使用條款閱讀更多資訊。