OPEN-SOURCE SCRIPT
已更新 Timebender 369 Time Calculator
Overview
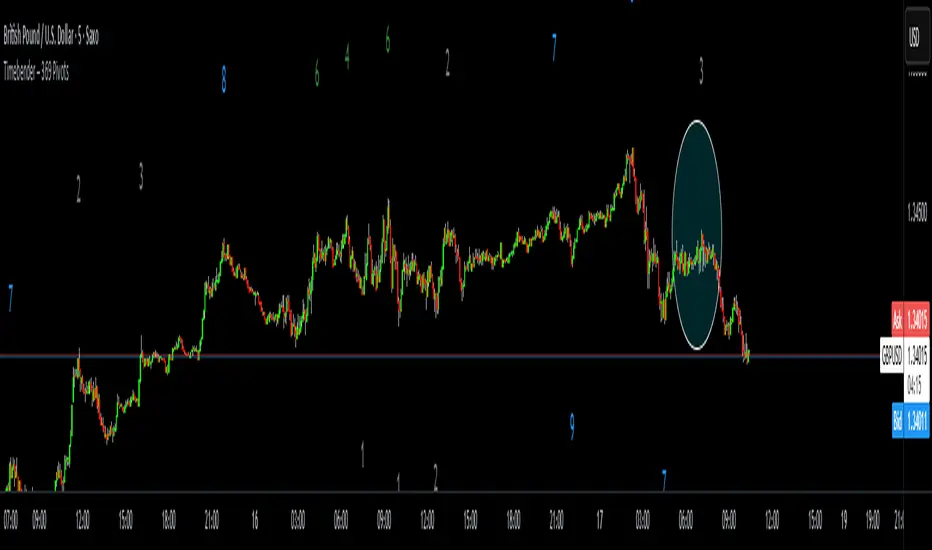
The Timebender Digits indicator visualizes rhythmic price cycles by marking confirmed swing highs and lows with dynamically colored numerical stamps.
Each number is derived from the sum of the current candle’s hour and minute, reduced to a single digit (1–9), providing a visual “time signature” for each structural turn in market flow.
This is a structural-pivot model inspired by LuxAlgo’s swing logic, rebuilt from the ground up in Pine v6 using the Timebender Rulebook framework for flawless compilation and precision label anchoring.
Core Features
Dynamic Swing Detection:
Detects structural highs/lows using ta.pivothigh() and ta.pivotlow(), confirmed after the selected number of bars (len).
Digit Logic (1–9):
Converts the pivot candle’s timestamp into a reduced digit from 1–9, acting as a symbolic rhythm marker.
Phase-Based Coloring:
1-3 → Accumulation (Gray)
4-6 → Manipulation (Green)
7-9 → Distribution (Blue)
Floating or Fixed Labels:
Option to keep digits visually anchored above/below candles (yloc.abovebar/belowbar) or locked to price (yloc.price) with customizable ATR offset.
Clean Visuals:
Transparent background, no boxes, no tooltips — just crisp digits that scale smoothly with zoom.
Master Toggle:
Instantly hide/show all digits without removing the indicator.
Inputs & Customization
Show Digits on Chart: Enable/disable plotting.
Pivot Length: Number of bars used to confirm swings (default 21).
Float Above/Below Bars: Switch between floating or price-anchored mode.
ATR Offset Multiplier: Adjust spacing when price-anchored.
Digit Size: Tiny → Huge (default Large).
Color Controls: Customize the Accumulation, Manipulation, and Distribution color palette.
Use Cases
Visualize time-based rhythm in market structure.
Identify cyclical energy between accumulation, manipulation, and distribution phases.
Study how market timing aligns with structural swing formation.
發行說明
We just changed the name thats shown, simple and clearer. 發行說明
Name change, to appear more clean開源腳本
本著TradingView的真正精神,此腳本的創建者將其開源,以便交易者可以查看和驗證其功能。向作者致敬!雖然您可以免費使用它,但請記住,重新發佈程式碼必須遵守我們的網站規則。
once you see what is possible, how can you do otherwise?
免責聲明
這些資訊和出版物並不意味著也不構成TradingView提供或認可的金融、投資、交易或其他類型的意見或建議。請在使用條款閱讀更多資訊。
開源腳本
本著TradingView的真正精神,此腳本的創建者將其開源,以便交易者可以查看和驗證其功能。向作者致敬!雖然您可以免費使用它,但請記住,重新發佈程式碼必須遵守我們的網站規則。
once you see what is possible, how can you do otherwise?
免責聲明
這些資訊和出版物並不意味著也不構成TradingView提供或認可的金融、投資、交易或其他類型的意見或建議。請在使用條款閱讀更多資訊。