OPEN-SOURCE SCRIPT
Reversal Zones
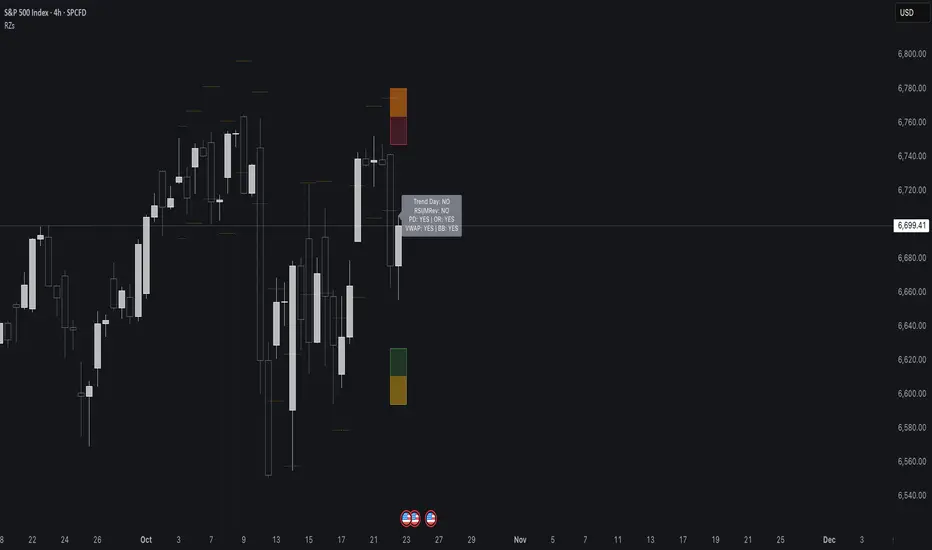
// This indicator identifies likely reversal zones above and below current price by aggregating multiple technical signals:
// • Prior Day High/Low
// • Opening Range (9:30–10:00)
// • VWAP ±2 standard deviations
// • 60‑minute Bollinger Bands
// It draws shaded boxes for each base level, then computes a single upper/lower reversal zone (closest level from combined signals),
// with configurable zone width based on the expected move (EM). Within those reversal zones, it highlights an inner “strike zone”
// (percentage of the box) to suggest optimal short-option strikes for credit spreads or iron condors.
// Additional features:
// • Optional Expected Move lines from the RTH open
// • 15‑minute RSI/Mean‑Reversion and Trend‑Day confluence flags displayed in a dashboard
// • Toggles to include/exclude each signal and adjust styling
// How to use:
// 1. Adjust inputs to select which levels to include and set the expected move parameters.
// 2. Reversal boxes (red above, green below) show zones where price is most likely to reverse.
// 3. Inner strike zones (darker shading) guide optimal short-strike placement.
// 4. Dashboard confirms whether mean-reversion or trend-day conditions are active.
// Customize colors and visibility in the settings panel. Enjoy disciplined, confluence-based trade entries!
開源腳本
秉持TradingView一貫精神,這個腳本的創作者將其設為開源,以便交易者檢視並驗證其功能。向作者致敬!您可以免費使用此腳本,但請注意,重新發佈代碼需遵守我們的社群規範。
免責聲明
這些資訊和出版物並非旨在提供,也不構成TradingView提供或認可的任何形式的財務、投資、交易或其他類型的建議或推薦。請閱讀使用條款以了解更多資訊。
開源腳本
秉持TradingView一貫精神,這個腳本的創作者將其設為開源,以便交易者檢視並驗證其功能。向作者致敬!您可以免費使用此腳本,但請注意,重新發佈代碼需遵守我們的社群規範。
免責聲明
這些資訊和出版物並非旨在提供,也不構成TradingView提供或認可的任何形式的財務、投資、交易或其他類型的建議或推薦。請閱讀使用條款以了解更多資訊。