PROTECTED SOURCE SCRIPT
CPD Approach Algo [ValiantTrader]
CPD Approach Algo Indicator Explained
This indicator, created by ValiantTrader, is a sophisticated tool for analyzing price action and market structure across different timeframes. Here's how it works and how traders use it:
Core Functionality
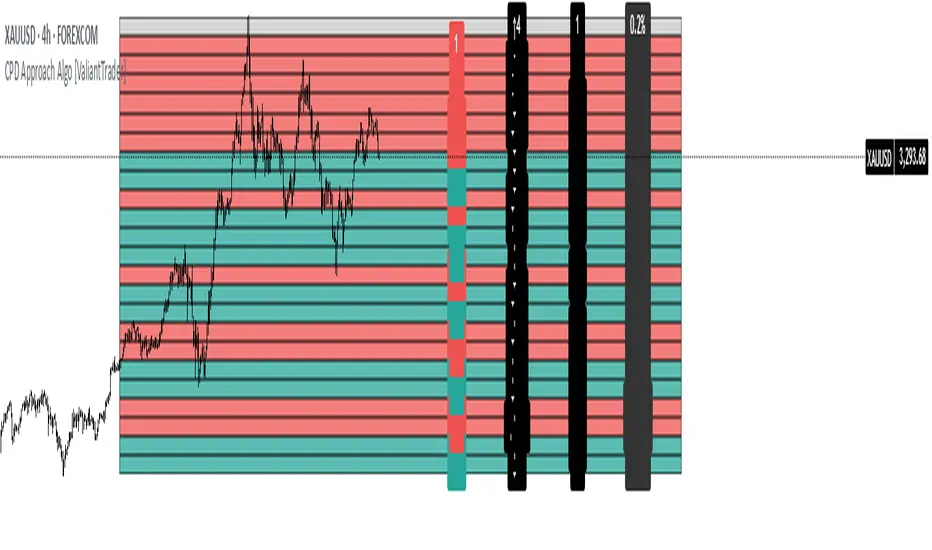
The CPD (Candle Price Distribution) Approach Algo divides the price range into horizontal zones and analyzes several key metrics within each zone:
Price Distribution: Shows where price has spent most time (high concentration areas)
Volume Clusters: Identifies zones with significant trading volume
Pressure Zones: Detects buying/selling pressure in specific price levels
Candle Differences: Highlights transitions between zones
How Traders Use It
1. Identifying Key Levels
The colored zones (green for buy, red for sell, gray neutral) show where price has historically reacted
Dense candle clusters indicate strong support/resistance areas
2. Volume Analysis
Volume clusters reveal where most trading activity occurred
High volume zones often act as magnets for price or reversal points
3. Pressure Detection
The pressure zones (with ↑ and ↓ arrows) show where buying or selling pressure was strongest
Helps identify potential breakout or reversal points
4. Multi-Timeframe Analysis
The custom timeframe input allows analyzing higher timeframe structure while viewing lower timeframe charts
Helps align trades with the dominant timeframe's structure
5. Transition Analysis
The delta values between zones show how price is moving between levels
Positive deltas (green) show upward momentum, negative (red) show downward
Practical Trading Applications
Support/Resistance Trading: Fade price at dense candle clusters with opposing pressure
Breakout Trading: Trade breaks from low-candle-count zones into high-volume zones
Mean Reversion: Trade returns to high-volume value areas after deviations
Trend Confirmation: Consistent pressure in one direction confirms trend strength
The indicator provides a comprehensive view of market structure by combining price, volume, and time elements across customizable timeframes, helping traders make more informed decisions about potential entries, exits, and key levels to watch.
This indicator, created by ValiantTrader, is a sophisticated tool for analyzing price action and market structure across different timeframes. Here's how it works and how traders use it:
Core Functionality
The CPD (Candle Price Distribution) Approach Algo divides the price range into horizontal zones and analyzes several key metrics within each zone:
Price Distribution: Shows where price has spent most time (high concentration areas)
Volume Clusters: Identifies zones with significant trading volume
Pressure Zones: Detects buying/selling pressure in specific price levels
Candle Differences: Highlights transitions between zones
How Traders Use It
1. Identifying Key Levels
The colored zones (green for buy, red for sell, gray neutral) show where price has historically reacted
Dense candle clusters indicate strong support/resistance areas
2. Volume Analysis
Volume clusters reveal where most trading activity occurred
High volume zones often act as magnets for price or reversal points
3. Pressure Detection
The pressure zones (with ↑ and ↓ arrows) show where buying or selling pressure was strongest
Helps identify potential breakout or reversal points
4. Multi-Timeframe Analysis
The custom timeframe input allows analyzing higher timeframe structure while viewing lower timeframe charts
Helps align trades with the dominant timeframe's structure
5. Transition Analysis
The delta values between zones show how price is moving between levels
Positive deltas (green) show upward momentum, negative (red) show downward
Practical Trading Applications
Support/Resistance Trading: Fade price at dense candle clusters with opposing pressure
Breakout Trading: Trade breaks from low-candle-count zones into high-volume zones
Mean Reversion: Trade returns to high-volume value areas after deviations
Trend Confirmation: Consistent pressure in one direction confirms trend strength
The indicator provides a comprehensive view of market structure by combining price, volume, and time elements across customizable timeframes, helping traders make more informed decisions about potential entries, exits, and key levels to watch.
受保護腳本
此腳本以閉源形式發佈。 不過,您可以自由使用,沒有任何限制 — 點擊此處了解更多。
免責聲明
這些資訊和出版物並非旨在提供,也不構成TradingView提供或認可的任何形式的財務、投資、交易或其他類型的建議或推薦。請閱讀使用條款以了解更多資訊。
受保護腳本
此腳本以閉源形式發佈。 不過,您可以自由使用,沒有任何限制 — 點擊此處了解更多。
免責聲明
這些資訊和出版物並非旨在提供,也不構成TradingView提供或認可的任何形式的財務、投資、交易或其他類型的建議或推薦。請閱讀使用條款以了解更多資訊。