OPEN-SOURCE SCRIPT
Crypto$ure EMA with 4H Trend Table
The Crypto URE EMA indicator provides a clear, multi-timeframe confirmation setup to help you align your shorter-term trades with the broader market trend.
Key Features:
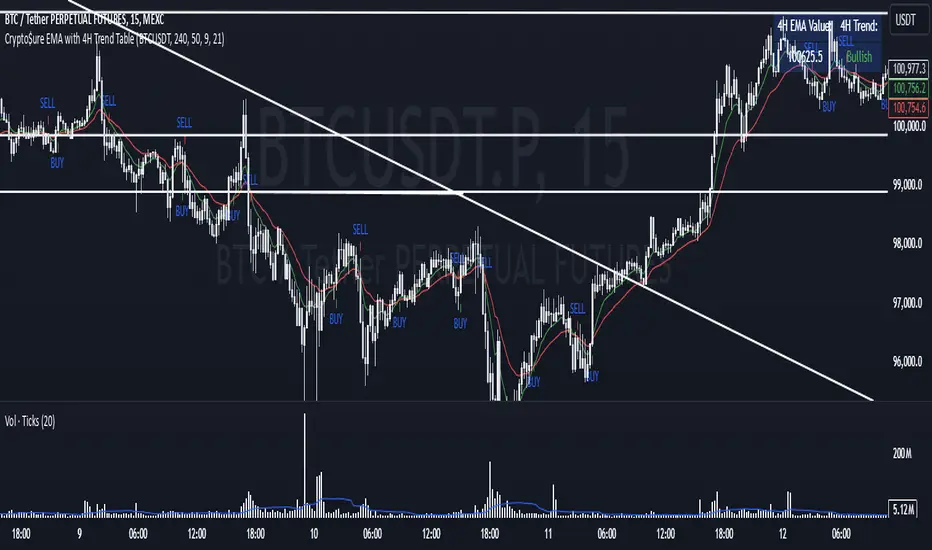
4-Hour EMA Trend Insight:
A table, displayed at the top-right corner of your chart, shows the current 4-hour EMA value and whether the 4-hour trend is Bullish, Bearish, or Neutral. This gives you a reliable, higher-timeframe perspective, making it easier to understand the general market direction.
Lower Timeframe Signals (e.g., 25m or 15m):
On your chosen chart timeframe, the indicator plots two EMAs (Fast and Slow).
A Buy Signal (an up arrow) appears when the Fast EMA crosses above the Slow EMA, indicating potential upward momentum.
A Sell Signal (a down arrow) appears when the Fast EMA crosses below the Slow EMA, indicating potential downward momentum.
Manual Confirmation for Better Accuracy:
While the Buy/Sell signals come directly from the shorter timeframe, you can use the 4-hour trend information from the table to confirm or filter these signals. For example, if the 4-hour trend is Bullish, the Buy signals on the shorter timeframe may carry more weight. If it’s Bearish, then the Sell signals might be more reliable.
How to Use:
Add the CryptoURE EMA indicator to your chart.
Check the top-right table to see the current 4-hour EMA trend.
Watch for Buy (up arrow) or Sell (down arrow) signals on your current timeframe.
For added confidence, consider taking Buy signals only when the 4-hour trend is Bullish and Sell signals when the 4-hour trend is Bearish.
Note:
This indicator does not generate trading orders. Instead, it provides actionable insights to help guide your discretionary decision-making. Always consider additional market context, risk management practices, and personal trading rules before acting on any signal.
Key Features:
4-Hour EMA Trend Insight:
A table, displayed at the top-right corner of your chart, shows the current 4-hour EMA value and whether the 4-hour trend is Bullish, Bearish, or Neutral. This gives you a reliable, higher-timeframe perspective, making it easier to understand the general market direction.
Lower Timeframe Signals (e.g., 25m or 15m):
On your chosen chart timeframe, the indicator plots two EMAs (Fast and Slow).
A Buy Signal (an up arrow) appears when the Fast EMA crosses above the Slow EMA, indicating potential upward momentum.
A Sell Signal (a down arrow) appears when the Fast EMA crosses below the Slow EMA, indicating potential downward momentum.
Manual Confirmation for Better Accuracy:
While the Buy/Sell signals come directly from the shorter timeframe, you can use the 4-hour trend information from the table to confirm or filter these signals. For example, if the 4-hour trend is Bullish, the Buy signals on the shorter timeframe may carry more weight. If it’s Bearish, then the Sell signals might be more reliable.
How to Use:
Add the Crypto
Check the top-right table to see the current 4-hour EMA trend.
Watch for Buy (up arrow) or Sell (down arrow) signals on your current timeframe.
For added confidence, consider taking Buy signals only when the 4-hour trend is Bullish and Sell signals when the 4-hour trend is Bearish.
Note:
This indicator does not generate trading orders. Instead, it provides actionable insights to help guide your discretionary decision-making. Always consider additional market context, risk management practices, and personal trading rules before acting on any signal.
開源腳本
秉持TradingView一貫精神,這個腳本的創作者將其設為開源,以便交易者檢視並驗證其功能。向作者致敬!您可以免費使用此腳本,但請注意,重新發佈代碼需遵守我們的社群規範。
免責聲明
這些資訊和出版物並非旨在提供,也不構成TradingView提供或認可的任何形式的財務、投資、交易或其他類型的建議或推薦。請閱讀使用條款以了解更多資訊。
開源腳本
秉持TradingView一貫精神,這個腳本的創作者將其設為開源,以便交易者檢視並驗證其功能。向作者致敬!您可以免費使用此腳本,但請注意,重新發佈代碼需遵守我們的社群規範。
免責聲明
這些資訊和出版物並非旨在提供,也不構成TradingView提供或認可的任何形式的財務、投資、交易或其他類型的建議或推薦。請閱讀使用條款以了解更多資訊。